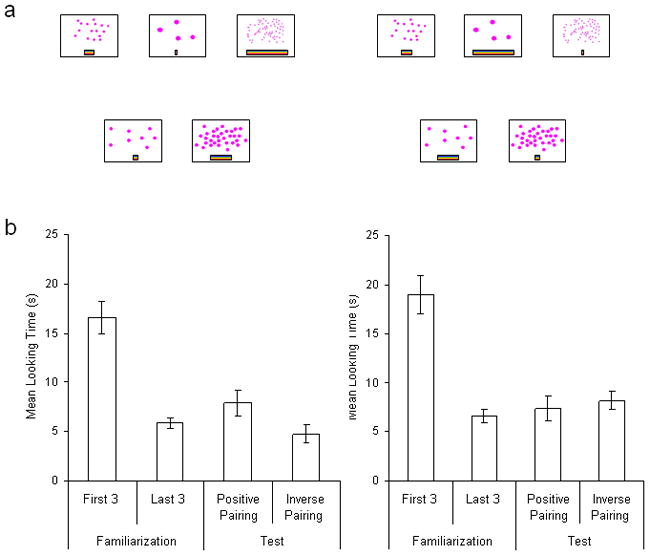
Fig. 2.

Infants’ learning of positive versus inverse relationships of number to length. The illustrations (a) show the displays presented in Experiments 2 and 3. The examples include numerical and line pairings used during familiarization (top) and test (bottom). Positive pairings are shown on the left, and inverse pairings on the right. The graph (b) shows mean looking times for the first three and last three familiarization trials and for the two kinds of test trials (positive and inverse pairings). Results are shown separately for Experiment 2 (left) and Experiment 3 (right). Error bars represent standard errors of the mean.
