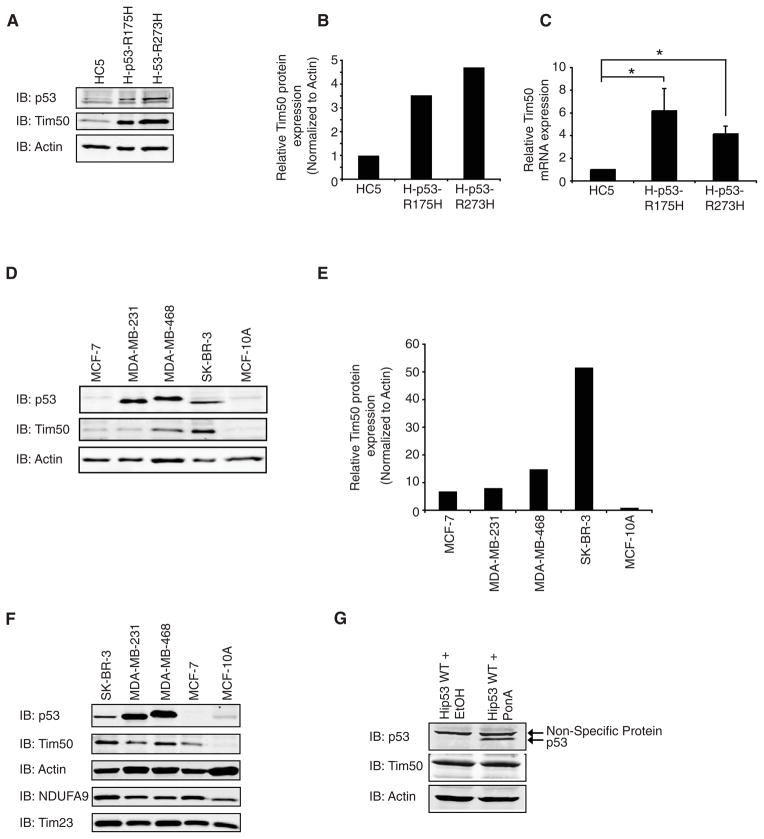
Fig. 2.
Expression of mutant p53 correlates with elevated levels of Tim50 mRNA and protein expression. (A) Total cell lysates from HC5, H-p53-R175H or H-p53-R273H cells were resolved by SDS-PAGE and immunoblotted with the indicated antibodies. A representative image is shown and the experiment was performed twice with similar results. (B). Quantitation of Tim50 protein levels was performed and normalized to actin levels. The amount of Tim50 protein expression in HC5 cells was set to 1 and the relative amount of Tim50 expression in H-p53-R175H or H-p53-R273H cells is shown. (C) Total RNA was extracted from HC5, H-p53-R175H or H-p53-R273H cells and quantitative real-time PCR was performed to determine Tim50 mRNA levels. The amount of Tim50 expression was determined using a relative standard curve after normalization to the internal standard, GAPDH mRNA. The normalized Tim50 mRNA level in the control cell line, HC5, was set to 1 and the relative level of Tim50 mRNA in H-p53-R175H or H-p53-R273H cells is shown. Results are mean (+/−) S.E.M (n=6). * = significance p< 0.05. (D) Equal protein amounts of total cell lysates from the indicated cell lines were resolved by SDS-PAGE and immunoblotted with the indicated antibodies. (E) Tim50 and actin protein levels were quantitated and the ratio of Tim50/actin protein levels are shown. (F) Equal protein amounts of total cell lysates from the indicated cell lines were immunoblotted with the indicated antibodies. (G) H1299 cells stably transfected with ecdysone-inducible WT p53 (Hip53 WT cells) were incubated in the presence of ethanol vehicle (EtOH) or 100 μM Ponasterone A (PonA) for 24 hrs. Total cell lysates were resolved by SDS-PAGE and immunoblotted with the indicated antibodies.

