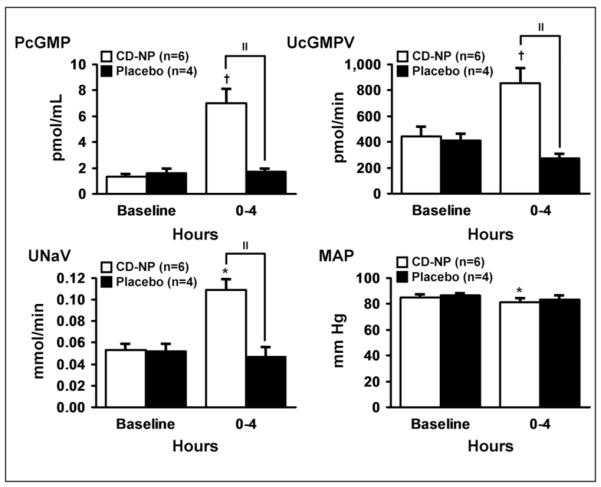
Figure 2.

Plasma cGMP response (top left), urinary cGMP excretion (top right), natriuretic response (bottom left), and blood pressure response (bottom right). Mean ± SEM. Comparisons were made within (*P < .05, †P <.01) and between groups (“P < .01).
