
Figure 3.
A plot of individual urinary sodium excretion (left panel, P < .05 vs baseline and P < .01 between groups) and urinary cGMP excretion (right panel, P < .01 vs baseline and P < .01 between groups) data. Mean ± SEM.
Official websites use .gov
A
.gov website belongs to an official
government organization in the United States.
Secure .gov websites use HTTPS
A lock (
) or https:// means you've safely
connected to the .gov website. Share sensitive
information only on official, secure websites.
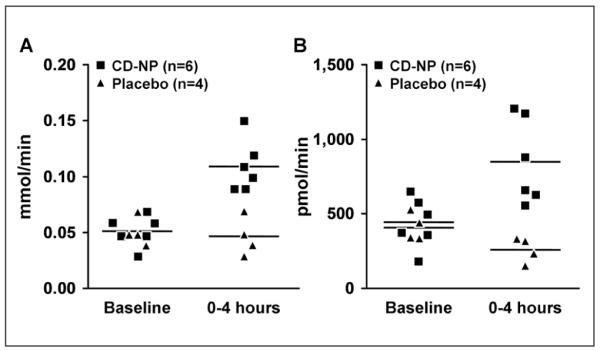
A plot of individual urinary sodium excretion (left panel, P < .05 vs baseline and P < .01 between groups) and urinary cGMP excretion (right panel, P < .01 vs baseline and P < .01 between groups) data. Mean ± SEM.