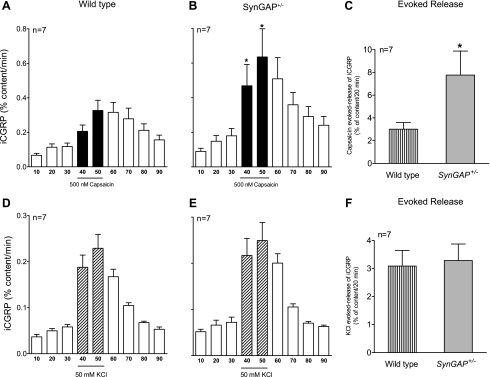
Fig. 2.
Capsaicin- and potassium-stimulated release of immunoreactive calcitonin gene-related peptide (iCGRP) from spinal cord tissue of WT and SynGAP+/− mice. A, B, D, E: each column represents mean ± SEM of iCGRP release expressed as percent peptide content/min of perfusion from spinal cord tissues taken from WT mice or SynGAP+/− mice. The open columns represent release when tissue is perfused with HEPES buffer for successive 10-min intervals, whereas the black columns (A and B) or hatched columns (D and E) represent release when tissues are perfused with HEPES buffer containing 500 nM capsaicin or 50 mM potassium, respectively. C, F: the evoked release of iCGRP is calculated by subtracting the basal release for 20 min prior to stimulus exposure from the capsaicin- or potassium-stimulated release in WT or SynGAP+/− mice. *Significant difference (P < 0.05) between genotypes using Student's t-test.

