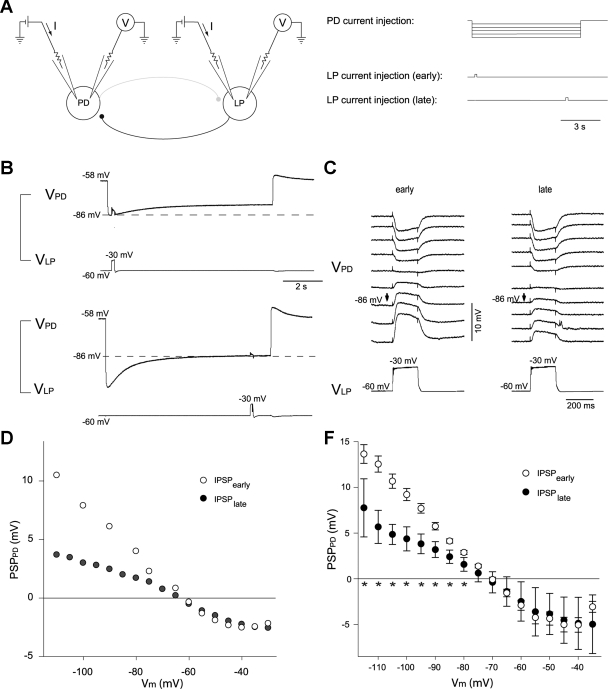
Fig. 7.
Amplitude of evoked LP inhibitory postsynaptic potentials (IPSPs) in the PD cell correlates with activation of Ih. A: recording configuration (left) and current injection paradigm (right). The PD and LP neurons were impaled with 2 electrodes each to allow independent current injection and voltage recording in each cell. Amplitudes are shown at the beginning (B, top, and C, left) of the hyperpolarizing voltage step in the PD cell, when very little Ih had been activated, and at the end of the PD hyperpolarization (B, bottom, and C, right), when Ih was maximally activated for that voltage, as shown by the depolarizing sag in the PD voltage. Arrows in C point to traces at equal membrane potential of the PD neuron (VPD; −86 mV) at the time of LP depolarization. VLP, membrane potential of LP neuron. D: IPSP amplitude at different membrane potentials (Vm) of 1 individual PD cell (PSPPD) at the beginning of PD polarizing current injection, when Ih was only weakly activated (IPSPearly) or at the end, when Ih was fully activated by the PD hyperpolarization (IPSPlate). E: summarized data from 11 experiments. ★P < 0.05.

