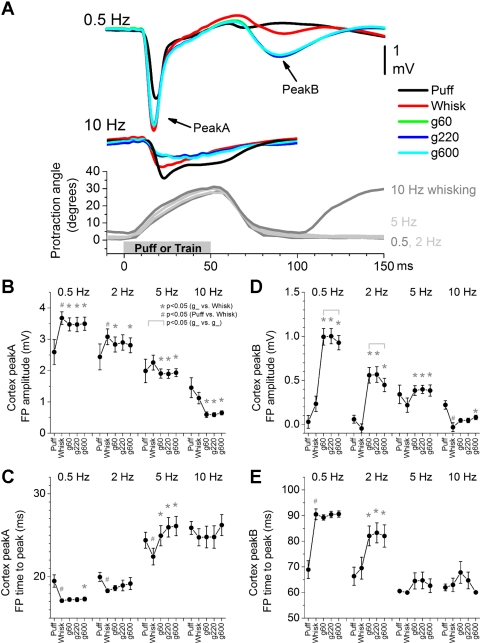
Fig. 1.
Population data showing the effect of air-puff stimulation (puff), whisking in air (whisk), and whisking on surfaces (g60, g220, and g600 sandpaper) on field potentials (FP) in the barrel cortex. A: overlaid mean traces of FP responses evoked by the different stimuli at 0.5 and 10 Hz (top). Bottom: whisker movement (angle in degrees) measured with video tracking during artificial whisking at 0.5, 2, 5, and 10 Hz (positive values indicate that the whiskers protracted). The maximum negative amplitude (B) and the time to peak (C) of short-latency (peakA) responses were measured during a 5- to 30-ms time window. The maximum negative amplitude (D) and the time to peak (E) of long-latency (peakB) responses were measured during a 50- to 100-ms time window. Statistical tests for data in B, C, D, and E compared the puff and whisking in air responses (#P < 0.05), the whisking in air and each of the whisking on surfaces responses (*P < 0.05), and the whisking on surfaces responses between each other (marked by brackets, P < 0.05). Values are means ± SE.

