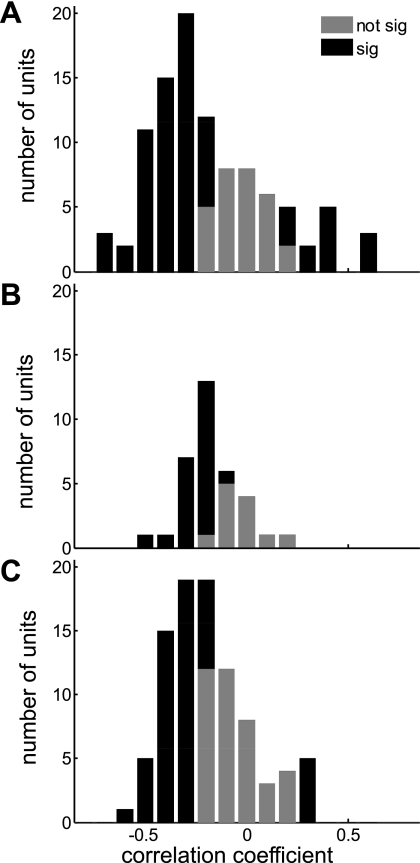
Fig. 5.
Analysis of units with on-off responses: distribution of correlation coefficients between on and off response sensitivity to ILDs (A), eITDs (B), and fITDs (C). Black bars represent units for which the tuning of on and off responses is significantly correlated (where correlations could be positive or negative). Gray bars represent units for which the correlation between on and off response tuning failed to reach statistical significance.

