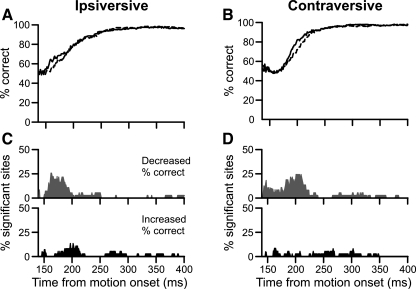
Fig. 10.
Summary of choice behavior for stimulation experiment. A: grand averages over time of instantaneous percent correct for control (solid trace) and stimulation (dashed trace) trials ipsiversive to the stimulation. Data are plotted from 136 ms after motion onset, at which time more than one-half of the stimulations were contributing data. B: same plotting conventions as in A for contraversive trials. C: percentage of sites with a significant changes in percent correct with stimulation. Gray trace (top) indicates the stimulation decreased percent correct; black trace (bottom) indicates that the stimulation increased percent correct. Note the y-axes only extend to 50%. D: same plotting conventions as in C for trials contraversive to the stimulation.

