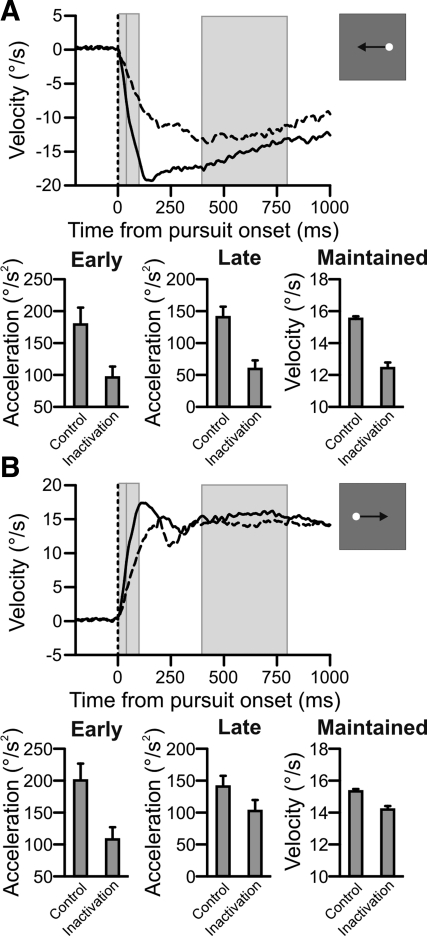
Fig. 2.
Inactivation impaired single-dot pursuit metrics: example data. A: horizontal velocity traces and measurements for control (solid line) and inactivation (dashed line) leftward pursuit trials, ipsiversive to the inactivation. The 3 gray vertical bars span 0–40, 41–100, and 400–800 ms after pursuit onset and correspond to early acceleration, late acceleration, and maintained velocity measurement intervals, respectively. Error bars are 95% confidence intervals. B: horizontal velocity traces and measurements for rightward pursuit trials, contraversive to the inactivation. Plotting conventions are identical to those in A.

