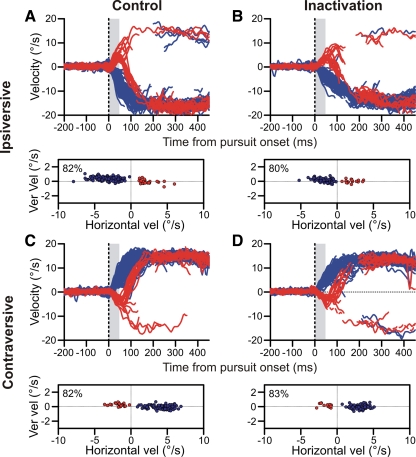
Fig. 4.
Inactivation failed to affect pursuit choice behavior: example data. A: horizontal velocity for all control trials in an example experiment where the correct target was moving ipsiversive to the inactivated side. Red and blue traces are incorrect and correct trials, respectively. Saccades are excised from the plots. Vertical gray bar is from 0 to 50 ms after pursuit onset. The scatter plot (bottom) shows the mean velocities for correct (blue) and incorrect (red) trials from this window. Percent correct is noted. B: horizontal velocity for ipsiversive trials following inactivation. C and D: horizontal velocity for contraversive trials before and after the inactivation, respectively. Plotting conventions are the same as in A and B. Ver vel, vertical velocity.

