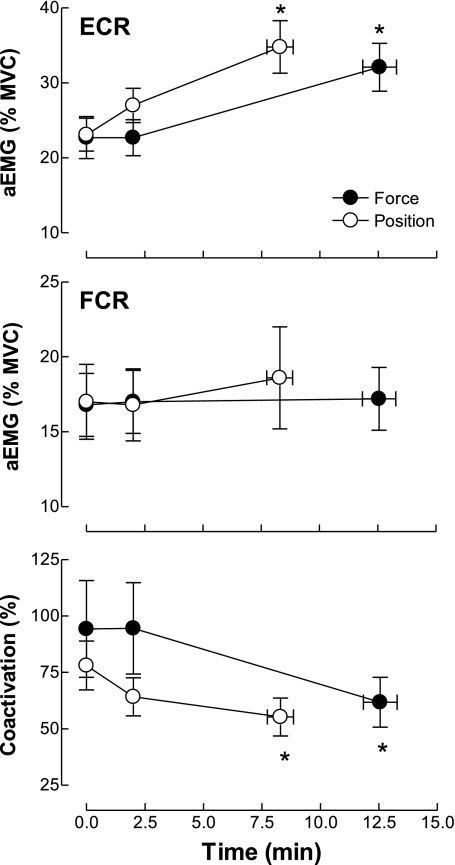
Fig. 2.
Changes in averaged and rectified EMG (aEMG) activity and coactivation ratio during the force and position tasks. aEMGs for the ECR (top) and FCR (middle) were normalized to maximal voluntary contraction (MVC) values (means ± SE). Bottom: the coactivation ratio [(FCR aEMG/ECR aEMG) × 100] was determined from values averaged over 1-s intervals before the stimulation sequence elicited at the start of the contraction, at 2 min, and just before failure. *P < 0.005 compared with initial values.

