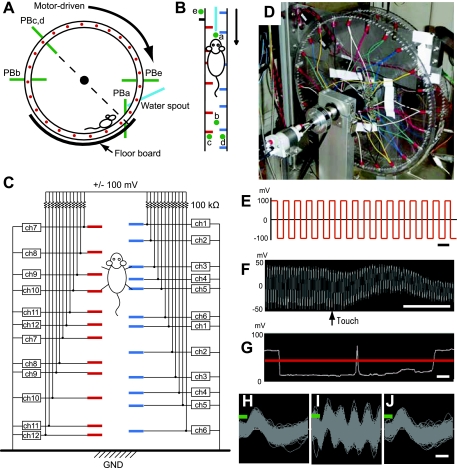
Fig. 3.
Instrumentation for monitoring behavior and peg patterns. A and B: scheme showing infrared photobeam system. Photobeams are shown in pink. Photobeam a (PBa) was used for detecting a mouse in close vicinity of the spout; photobeam b (PBb) for detecting the mouse if it was on the other side of the wheel; photobeams c and d (PBc and PBd) for detecting pegs on the left and right, respectively; and photobeam e (PBe) for detecting turn markers, which were used as markers of the initiation of a peg pattern. C: diagram illustrating the voltage sensor. Pegs were independently connected to the voltage sensor. ch, Channel; GND, ground. D: photograph of the wheel with the sensor attached. E: applied voltage schedule with 20-kHz square waves of ±100 mV loaded onto each peg. Scale bar, 50 μs. F: an example of recorded voltage. When the peg was touched, the amplitude was reduced. Scale bar, 5 ms. G: the voltage amplitude is shown as a white trace. A drop in amplitude below the chosen threshold (red line) was counted as a touch. Two touches were counted in this trace. Scale bar, 50 ms. H–J: waveforms of recorded voltage signals that exceeded the threshold for spike detection (green line) after being filtered to remove oscillations above 6 kHz, recorded while the touch sensor was turned off (I), turned on at 5 kHz (J), and turned on at 20 kHz (K). Scale bar, 200 μs.

