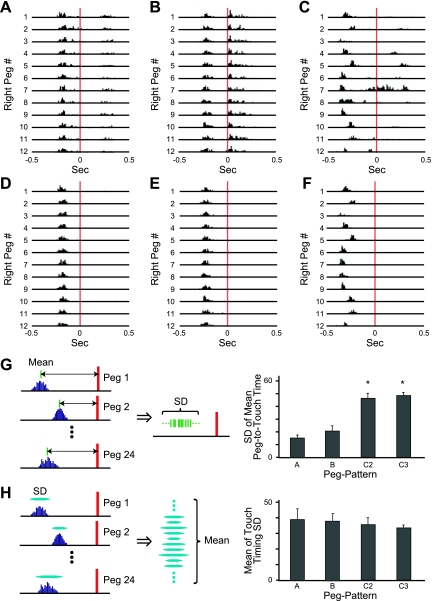
Fig. 4.
Touch analysis. A–C: all touches on each of 12 right pegs counted in a session with peg patterns A (A), B (B), and C2 (C) are shown in histograms. The touches are aligned to the time at which the corresponding peg arrived at the photobeam a location (red lines at time 0). D–F: the 1st touches in each trial of the same session as shown in A–C. G: times of peg touches, relative to peg arrival times, were averaged for all individual pegs. Then, the standard deviation of the averages over all pegs was calculated. Bottom shows standard deviations for peg patterns A, B, C2, and C3. *P < 0.001, A vs. C2, A vs. C3, B vs. C2, B vs. C3 (ANOVA and post hoc Tukey-Kramer test). H: the standard deviations of touches to a peg were calculated for all individual pegs. Then, the standard deviations were averaged over all pegs. These average standard deviations are shown for peg patterns A, B, C2, and C3.

