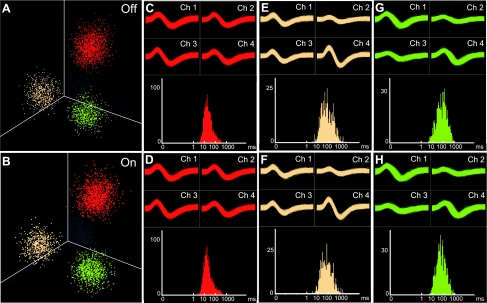
Fig. 6.
Recording of neural activity during performance in the running wheel. A, C, E, and G: unit activity recorded from 1 of the tetrodes implanted in the primary motor cortex of a mouse running in the wheel with the voltage sensor turned off. Spikes of putative single units (clusters) are shown in red, yellow, and green, and remaining spikes that were not included in these clusters are indicated by gray (A). Clusters of spikes are plotted based on spike height on channels 1–3. Spike waveforms recorded on each of the 4 tetrode channels (Ch 1–4; top) and interspike interval plots showing absolute refractory periods (bottom) are shown for the red (C), yellow (E), and green (G) units. B, D, F, and H: activity of units recorded from the same tetrode with the voltage sensor on, shown as in A, C, E, and G.

