Fig. 7.
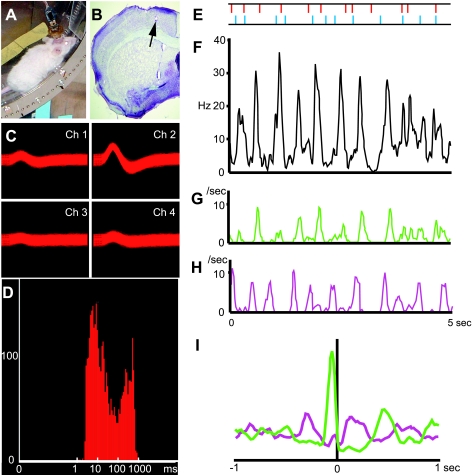
Simultaneous recordings of neuronal spike activity and paw touches from a mouse running in the Step-Wheel. A: mouse running in the wheel with a preamplifier connected to a 4-tetrode headstage. B: Nissl-stained brain section illustrating a tetrode track and its tip (arrow) in the primary motor cortex. C and D: spike waveforms (C) and interspike interval plot (D) for a putative single unit recorded. E: the peg pattern on which the mouse ran. The horizontal axes in F–H correspond to the span of this peg pattern. The right and left pegs are shown in blue and red, respectively. F: histogram of the spike activity of the unit shown in C and D. G and H: histogram of the timing of right (G) and left (H) peg touches. I: cross-correlograms of the timing of right (green) and left (purple) touches relative to all spike occurrences.

