
Figure 4. Evaluation of erlotinib efficacy in orthotopic xenografts.
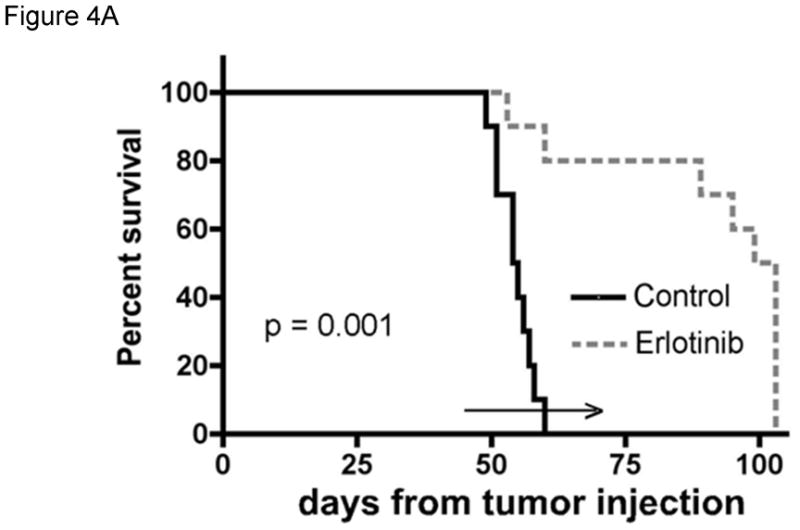
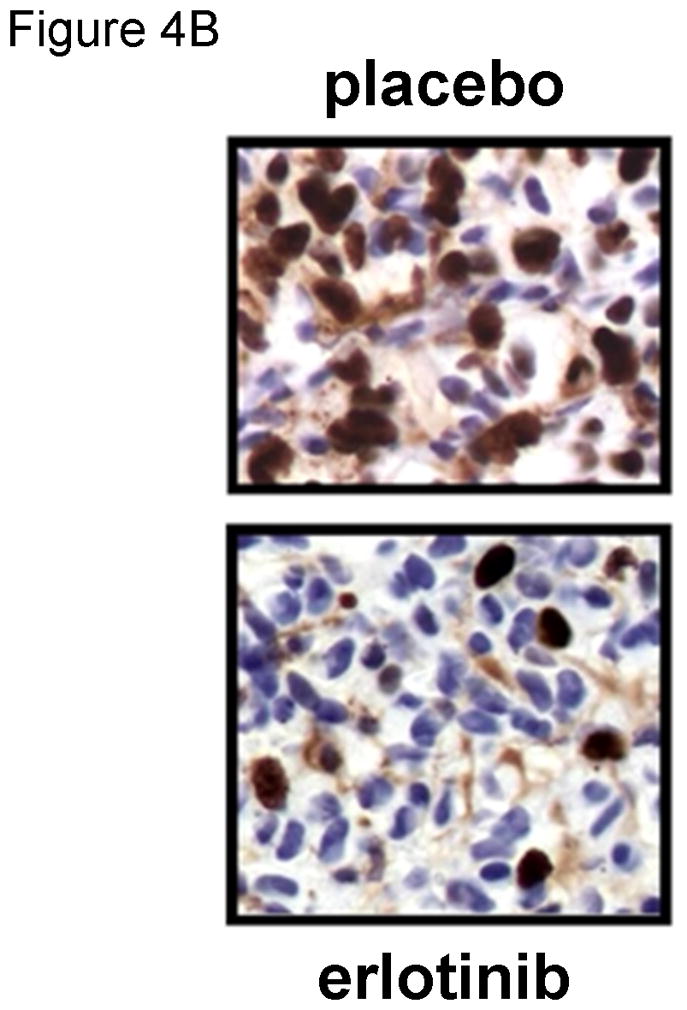


The efficacy of erlotinib was evaluated in mice bearing orthotopic GBM39 tumors transduced with a luciferase-expressing lentivirus prior to implantation. A) Kaplan-Meier survival curves for mice treated with daily oral erlotinib or placebo as shown by the horizontal arrow. B) Moribund mice were processed for MIB-1 IHC to assess changes in tumor cell proliferation in vivo. C). Luminescence intensity overlays showing serial results for a single placebo treated mouse and a single erlotinib treated mouse, with images recorded at days 42, 53, and 60 days for each, and additionally at days 67, 74, and 81 for the erlotinib-treated mouse. D) Luminescence readings were converted to normalized values by dividing each mouse’s luminescence readings with its corresponding maximal pre-treatment luminescence reading recorded at day 42. Mean normalized bioluminescence and corresponding standard error values for placebo and erlotinib groups have been plotted for each imaging session. The duration of treatment is indicated by the horizontal arrow. Data reproduced with permission from (Sarkaria, 2007).