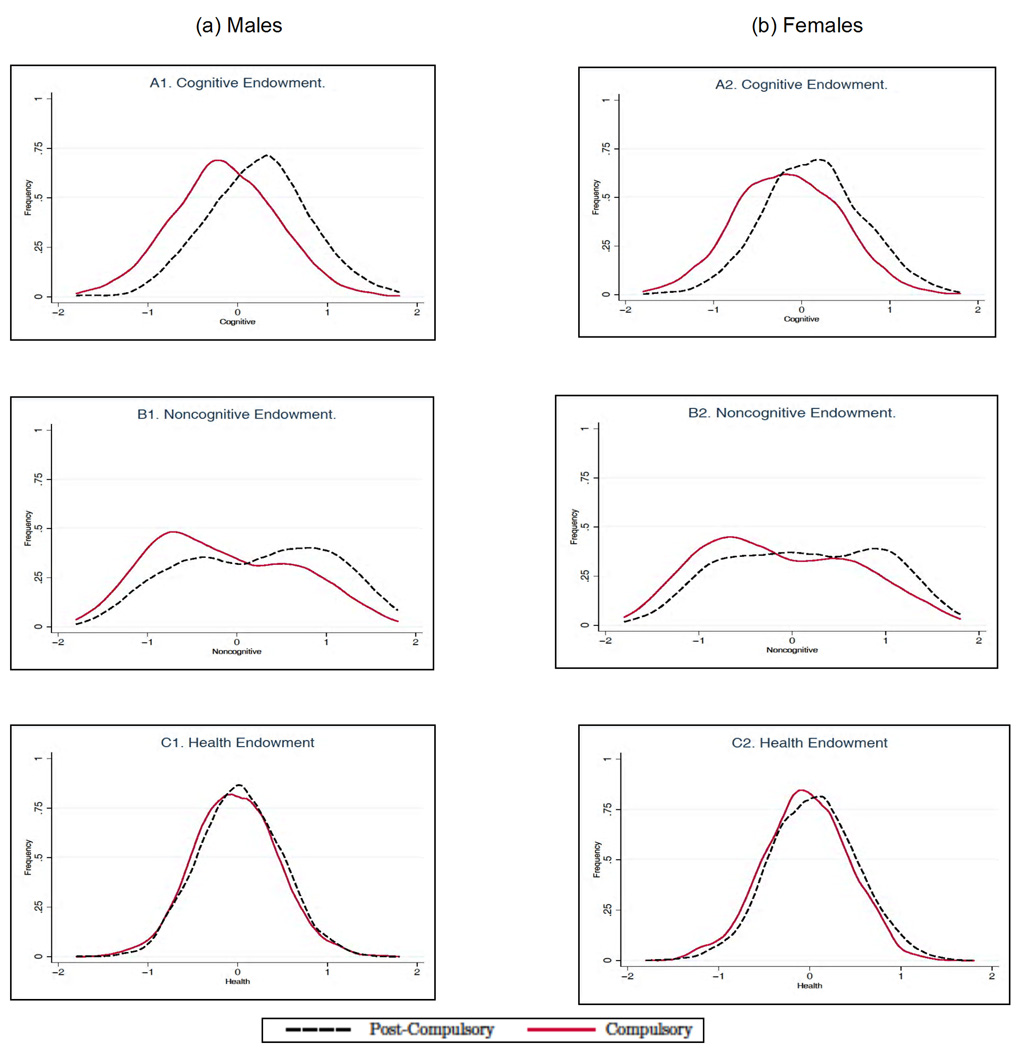
Fig. 3.
Marginal distributions of endowments for males (A) and females (B) by schooling level. The figures show the marginal distributions of cognitive, noncognitive, and health endowments and are generated using simulated data from our model. The simulated data contains the same number of observations as the actual data. Adapted from Conti, Heckman, and Urzua (2010a, 2010b).

