
Figure 2. PI3Kγ deficiency reduces cerebrovascular claudin-5 and collagen IV degradation and myosin light chain (MLC) phosphorylation.


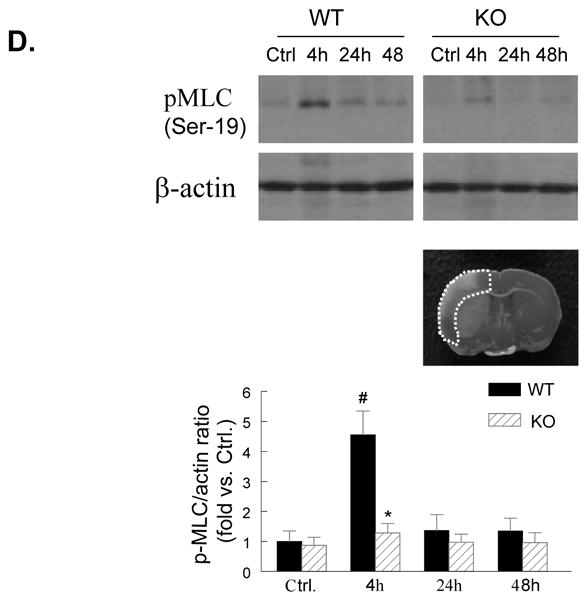
A through C, Immunostaining of claudin-5 (A), collagen IV (B), and phospho-MLC (Ser19) (C) in WT and PI3Kγ KO mice at 4, 24, and 48 h after tMCAO. The region of interest is shown in adjoining coronal section. Ctrl and Ipsi. represents contralateral and ipsilateral hemispheres, respectively. n=5 per time point per group. Scale bar: 50 μm. D, Western blot analysis of the phospho-MLC(ser19) (18 kDa) in the ischemic cortex (region of interest shown in adjoining coronal section). Samples from sham-operated animals served as controls. Quantified band intensities are presented as fold-changes of control (Ctrl). n= 4 per time point per group. *P<0.05 vs WT, #P<0.05 vs Ctrl.