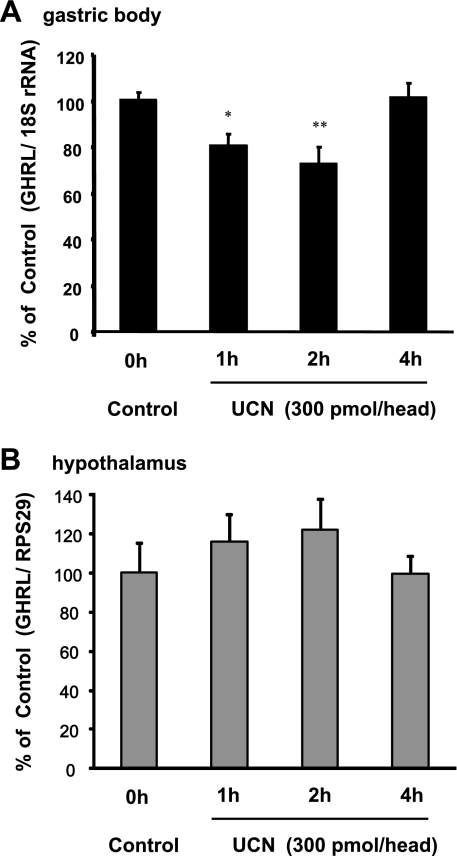
Fig. 3.
Preproghrelin mRNA expressions in the gastric body (A) and hypothalamus (B) after icv injection of UCN. Columns express means ± SE (n=8). Significance with post hoc Dunnett's t-test following one-way ANOVA: *P < 0.05 and **P < 0.01 vs. pre-UCN injection (control). Quantitative gene expression analysis was performed by real-time RT-PCR using ribosomal protein S29 or 18S ribosomal RNA as the reference gene.

