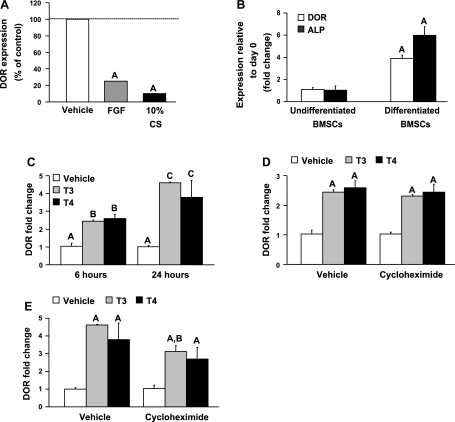
Fig. 1.
Diabetes- and obesity-related protein (DOR) expression during osteoblast proliferation and differentiation. A: DOR expression decreases during osteoblast proliferation. MC3T3-E1 cells were treated with or without fibroblast growth factor (FGF; 1 ng/ml) or 10% calf serum (CS) for 24 h. DOR expression was determined by real-time RT-PCR analysis. DOR expression in vehicle-treated control (ΔCT = 9.74 ± 0.07). Values are presented as %vehicle-treated control ± SE (n = 3). AP < 0.01 vs. vehicle. B: DOR expression increases during bone marrow stromal cell (BMSC) differentiation, as measured by real time RT-PCR. BMSCs were cultured with α-MEM containing 10% CS in the presence or absence of ascorbic acid (100 μg/ml) and β-glycerophosphate (10 mM) for 24 days to induce osteoblast differentiation. Alkaline phosphatase (ALP) gene expression was also assessed to confirm BMSC differentiation. DOR expression in undifferentiated BMSCs (ΔCT = 11.24 ± 0.27). Values are presented as fold change relative to day 0 ± SE (n = 6). AP < 0.001 vs. undifferentiated BMSCs. C: thyroid hormone (TH) stimulates DOR gene expression. MC3T3-E1 cells were incubated in the presence or absence of 3,3′,5-triiodothyronine (T3; 10 ng/ml) or l-thyroxine (T4; 100 ng/ml) for 6 or 24 h. DOR expression was determined by real-time RT-PCR analysis. Values are presented as fold change from corresponding vehicle control ± SE (n = 3–5). Data with different letters indicate significant difference at P < 0.05. Treatment groups with same letters are not statistically different. D and E: TH induction of DOR is acute and is minimally affected by de novo protein synthesis. MC3T3-E1 cells were pretreated with cycloheximide (1 μM) for 1 h prior to the addition of T3 (10 ng/ml) or T4 (100 ng/ml) for 6 (D) or 24 h (E). DOR expression was determined by real-time RT-PCR analysis. DOR expression was 60% lower in cycloheximide vehicle group compared with vehicle alone at 24 h. ΔCT = 9.39 ± 0.11, DOR expression in vehicle-treated control. Values are presented as fold change from corresponding vehicle control ± SE (n = 3–5). AP < 0.05 vs. vehicle control; BP < 0.05 vs. T3 alone.

