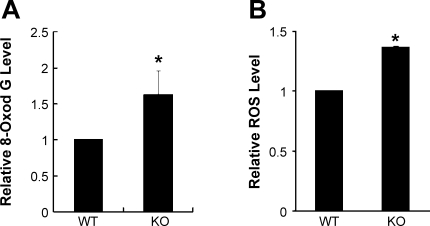
Fig. 2.
Increased reactive oxygen species (ROS) and oxidative damage in TR4−/− tissues. A: 8-oxodeoxyguanosine (8-OxodG) staining was carried out in old (>12 mo) WT and KO mouse (>12 mo) liver tissues, as described in experimental procedures. The number of 8-OxodG-positive cells/500 cells was counted, and the percentage was calculated. A total of 2,000 cells were counted from each mouse. Shown are the average percentage ± SD (n = 4). B: tissue ROS levels were quantified in liver extracts from WT and KO mice by dichorofluorescein staining and flow cytometric analyses. Shown are the mean fluorescence intensity ± SD (n = 5). *P < 0.05 vs. WT.

