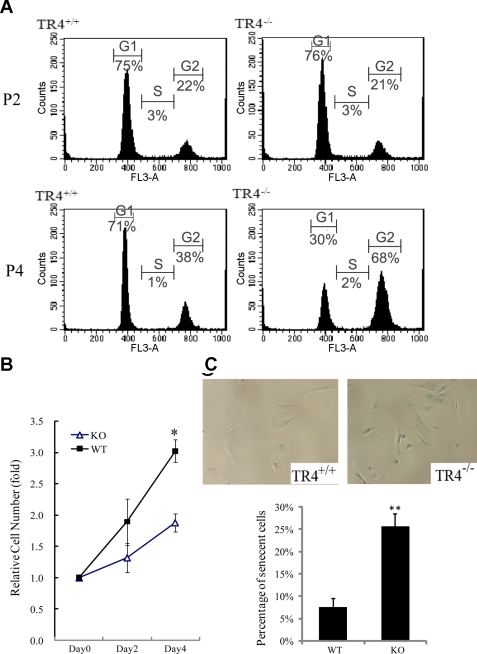
Fig. 3.
Growth arrest and early onset of cellular senescence in TR4−/− mouse embryonic fibroblasts (MEFs). A: cell cycle profile analysis of passages 2 (P2) and 4 (P4; MEFs from TR4−/− and TR4+/+ mice). TR4−/− display an early G2/M arrest in P4, whereas P4 TR4+/+ MEFs showed a normal cell cycle distribution. B: the growth rate of MEFs from TR4+/+ (WT) and TR4−/− (KO) was examined by 3-[4,5-dimethylthiazole-2-yl]-2,5-diphenyltetrazolium bromide (MTT) assay. The MEFs, from both genotypes at P5, were seeded and harvested at indicated days. The growth rate was calculated as the ratio to day 0. Three independent experiments were carried out, and the representative results are shown. Shown are means ± SD (*P < 0.05 vs. WT). C: P5 TR4+/+ and TR4−/− MEFs were subjected to senescence-associated β-galactosidase (SA-β-Gal) staining, as described in experimental procedures (top). Cellular senescence was indicated by the blue-colored staining. The percentage of SA-β-Gal staining positive cells was counted. Representative pictures from TR4+/+ and TR4−/− MEFs are shown (bottom). **P < 0.01 vs. WT.

