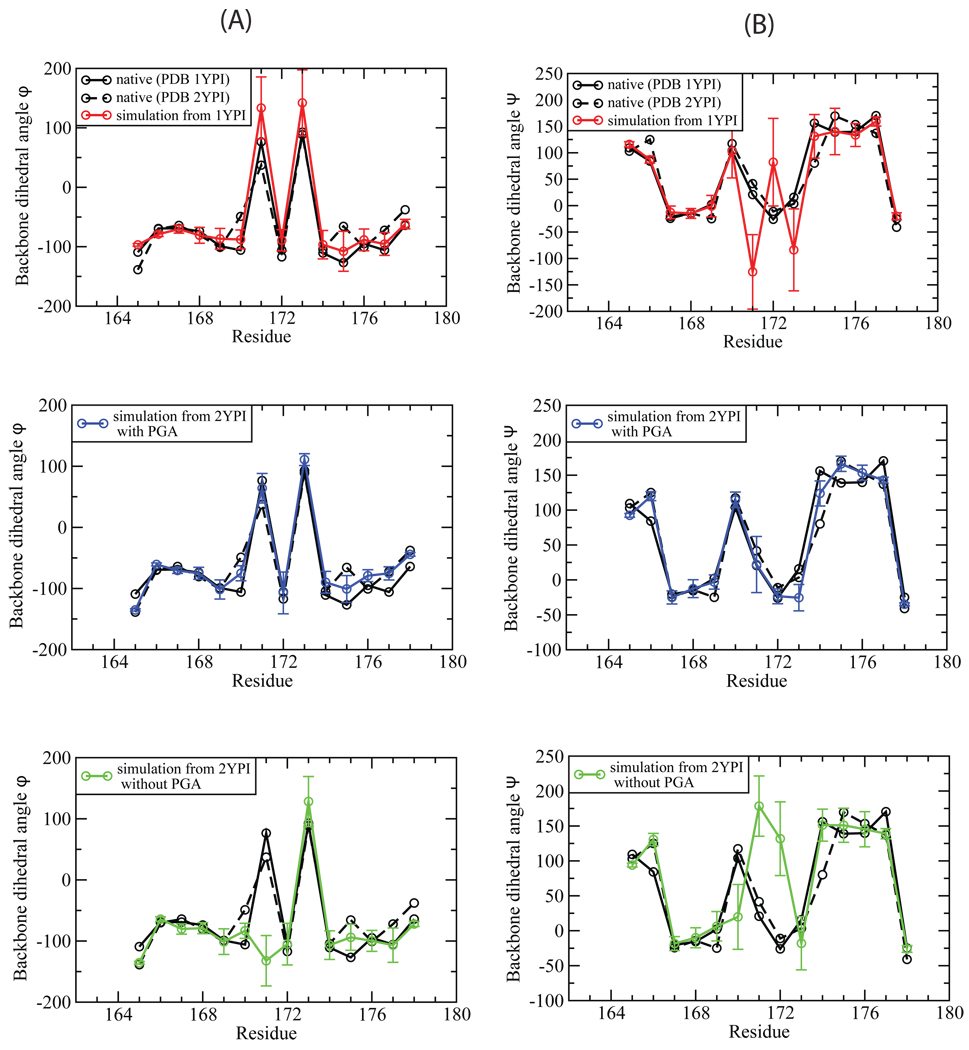
Fig. 5.
The comparison of the calculated backbone dihedral angles, ϕ (A) and ψ (B), with those measured in the X-ray structures. The black solid line is for apo TIM (PDB 1YPI) and the dashed line for the ligand-bound TIM (PDB 2YPI). The calculated dihedral angles were averaged over the equilibrium ensemble simulated from the initial structure of apo (red), ligand-bound (blue), and closed form with the ligand PGA removed (green).

