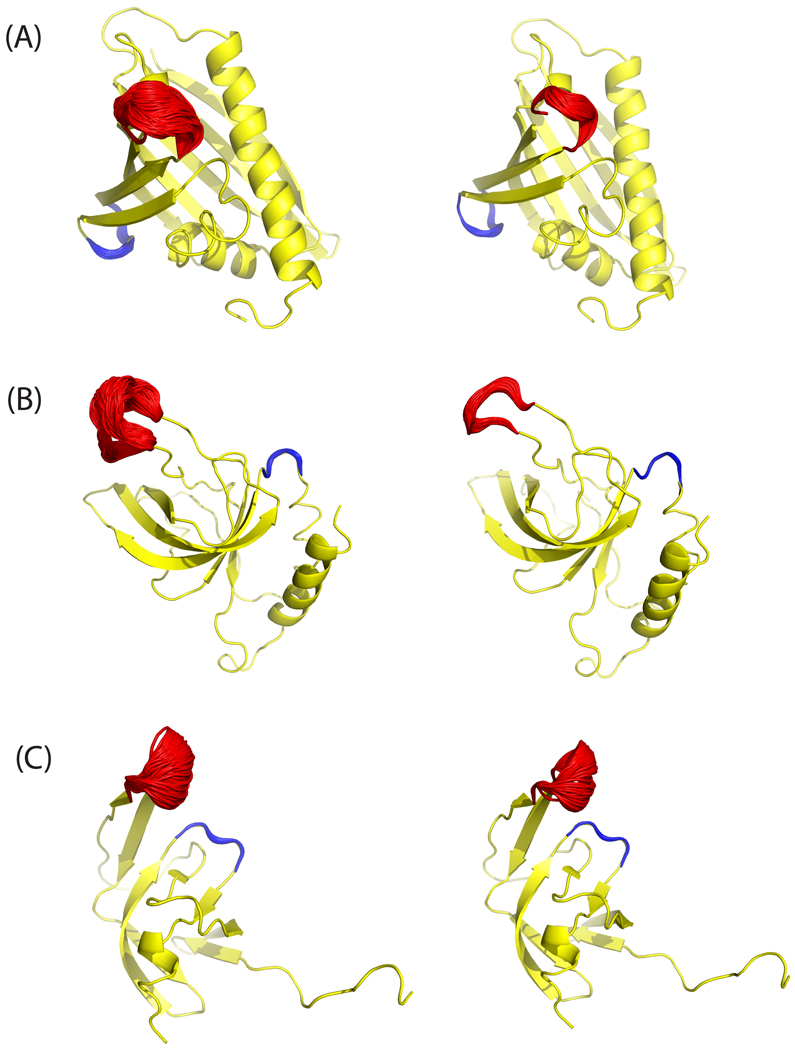
Fig. 7.
Ensembles of loop structures from equilibrium simulations using MC sampling for proteins with PDB ID: (A) 1H2O, (B) 1XWE and (C) 1Q9P sampled at T=600 K (left) and T=300 K (right). The sampled flexible loops (‘floppy’) which have large fluctuation in the NMR models are shown in red and the rigid loops with very small fluctuations are in blue. The structures in yellow are taken from MODEL 1 of the PDB file.

