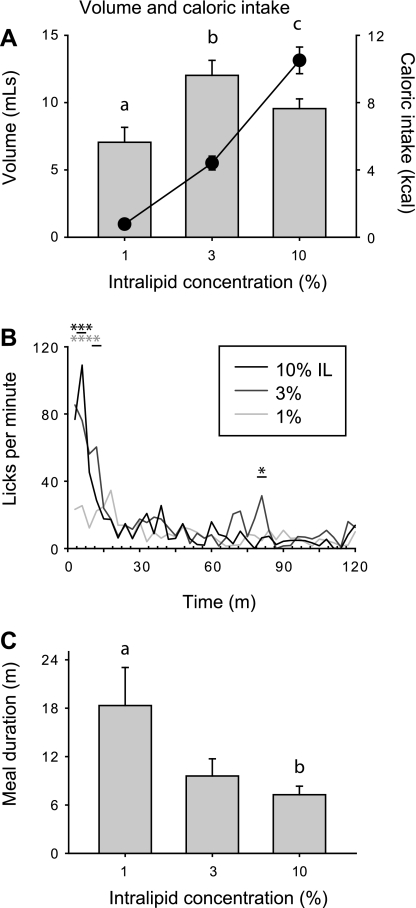
Fig. 1.
A: mean ± SE intake of 1, 3, and 10% Intralipid during 2-h sessions (bars, units on left y-axis) and mean caloric intake for each solution (circles, units on right y-axis). Different letters indicate statistically significant differences (for both volume and calories consumed). B: mean lick rate over the course of experimental sessions. Asterisks indicate significant differences between lick rates during 10% (black) and 3% (gray) Intralipid consumption vs. 1%. Underlined asterisks indicate significant differences relative to both of the other Intralipid concentrations. C: mean meal duration. Different letters indicate statistically significant differences.

