Fig. 7.
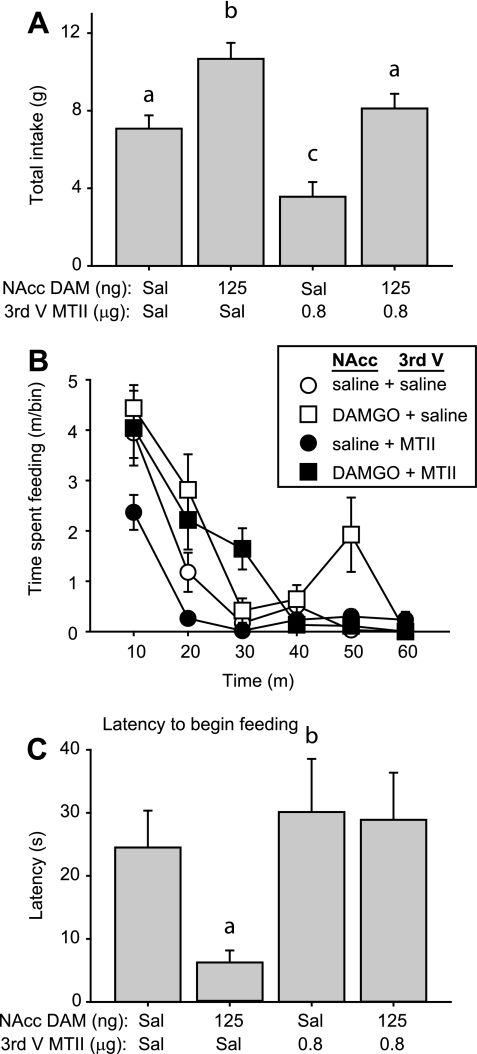
A: mean ± SE consumption of high-fat chow following drug infusion into the NAcc core (saline or 125 ng DAMGO/NAcc) and third ventricle (third V; saline or 0.8 μg MTII). B: time spent feeding during consecutive 10-min bins during 1-h test session. C: latency to begin feeding. Different letters indicate statistically significant differences.

