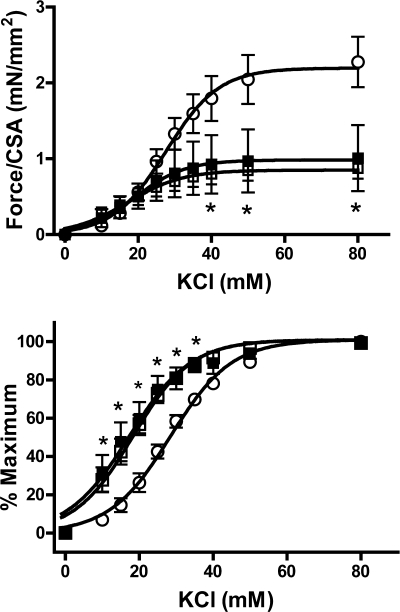
Fig. 2.
Contractile response of uremic aortas to KCl. Top: absolute force as a function of KCl concentration. Bottom: relative force as a function of KCl concentration. ○, Control (n = 6); □, uremic, noncalcified (n = 8); ■, uremic, calcified (n = 6). Rats were fed a 23% protein and 1.06% phosphorus diet. CSA, cross-sectional area. *P < 0.05 compared with control by 2-way, repeated-measures ANOVA followed by Bonferroni correction.

