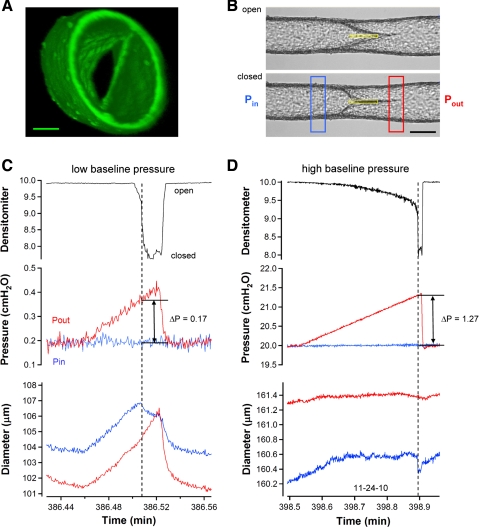
Fig. 4.
Valve closure tests performed on a single-valve vessel in Ca2+-free solution. A: confocal reconstruction of a secondary valve in a rat mesenteric lymphatic obtained in Ca2+-free solution to prevent contractions. View is taken from downstream, looking back (against normal flow) into the valve. Structures at 1 o'clock and 7 o'clock at the inner edge of the lumen are the valve insertion points, or buttresses. Calibration bar = 40 μm. B: images of a representative vessel with the valve in the open (top) and closed (bottom) positions. Single densitometer window used to detect valve leaflet position is shown in yellow. Calibration bar = 120 μm. C and D: densitometer, pressure, and diameter traces are similar to those described in previous figures (no PL recordings were necessary under these conditions because all pressures could be controlled). Tests begin with Pin (red trace) and Pout (blue trace) equal in which case the valve is open. A ramp-wise increase in Pout is imposed until the valve closes. Pout and Pin levels at the instant of closure are recorded and the difference (Pout − Pin) is the minimal pressure gradient required for closure. Diameter traces on both sides of the valve are recorded at sites corresponding to the colored windows in B. Test in C starts at the lowest baseline pressure level used (0.2 cmH2O), whereas the test in D starts at the highest level of baseline pressure used (20 cmH2O). Both recordings are from the same vessel. Note the difference in the diameter and pressure scales between C and D.

