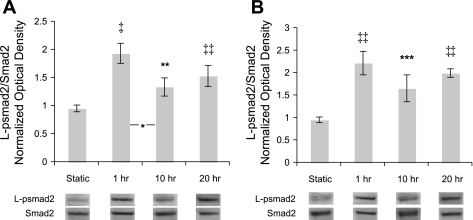
Fig. 2.
L-psmad2 time course over 20 h of flow exposure at 80 ± 5 mmHg and exemplary Western blot lanes. Plot points and blot quantification was performed as in Fig. 1. All flow points had significantly more L-psmad2 than static control. A: 2 dyn/cm2 average shear stress. A significant drop in L-psmad2 levels was measured between 1 and 10 h samples. B: 10 dyn/cm2 average shear stress (n = 4 all conditions). *P < 0.05; **P < 0.01; ***P < 0.005; ‡P < 0.001; ‡‡P < 0.0001.

