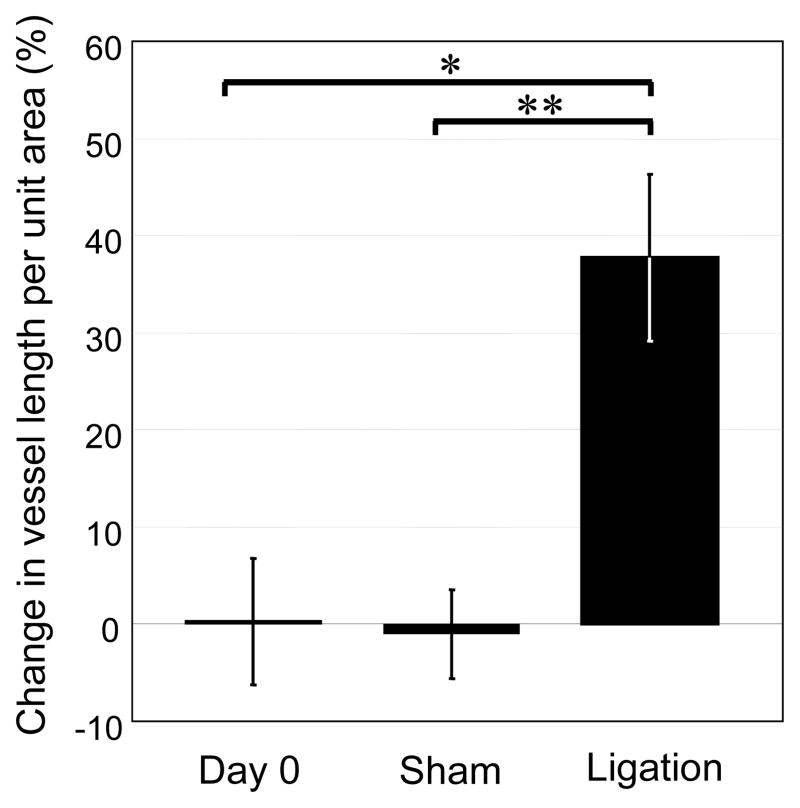
Figure 3.
Intravital microscopy. Quantification of perfused (functional) blood vessel density on day 0 (n=6) and five days after sham (n=3) or arterial ligation (n=6). Following anesthesia, exposure of the spinotrapezius muscles, and abolishment of vascular tone (maximally dilated), three to four intravital images per mouse were analyzed and average total vessel lengths per unit area were calculated. Change in length per unit area in tissues receiving an intervention (or left muscle for mice in day 0 group) are reported as a percentage of length per unit area in contralateral control (or right muscle for mice in day 0 group). Values are mean ± SD *p ≤ 0.05.

