Figure 6.
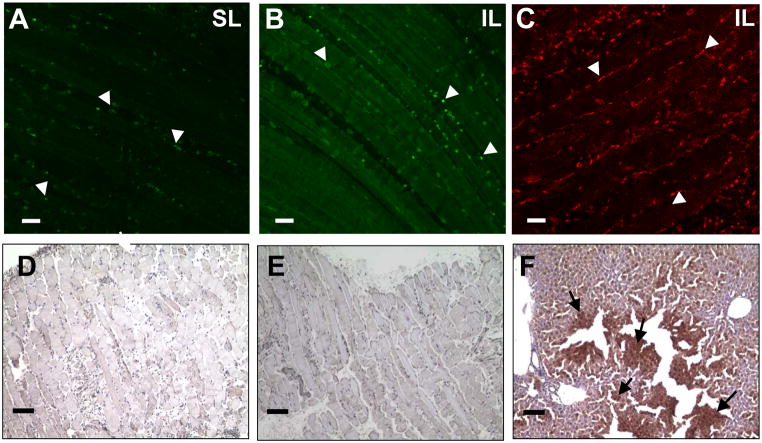
Representative confocal images (20x) of tissues that underwent (A) sham ligation or (B) ischemic ligation immunolabeled for CD11b expressing cells (white arrowheads). There was a negligible presence of CD11b-expressing cells in the day 0 control tissues that received no intervention (data not shown). (C) Ischemic tissue immunolabeled with MOMA-2 antibodies showing leukocyte infiltration into injury site. Scale bars are 50 μm. Representative light microscopy images (10x) from paraffin-embedded sections of (D) sham ligation, (E) ischemic ligation, and (F) mouse liver positive-control tissues probed for the presence of hypoxic cells (Hypoxyprobe-1+ kit; Chemicon International). All skeletal muscle undergoing either ischemic or sham ligations stained negative for hypoxic cells, while the positive control, mouse liver, stained positive for hypoxic cells (black arrows). Scale bars are 100 μm.

