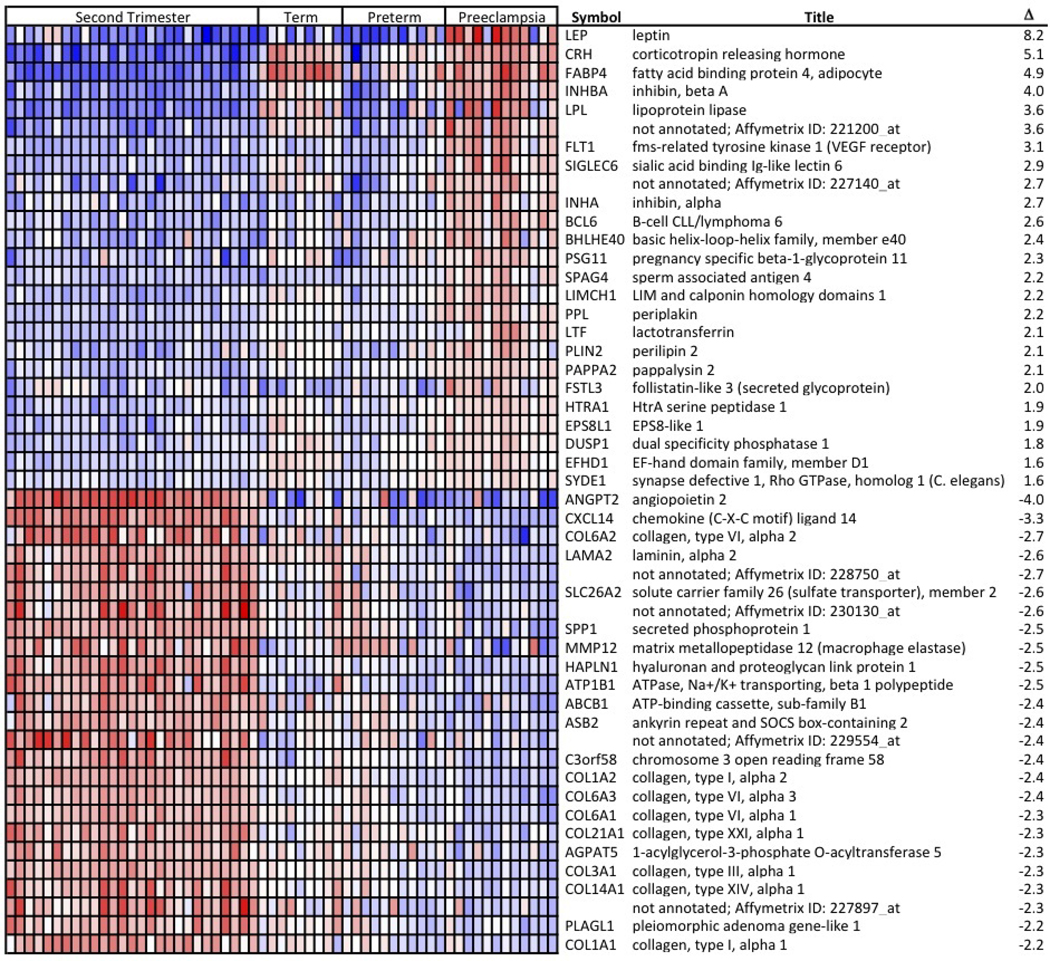
Figure 5. Heat map of the most highly up regulated and down regulated differentially expressed genes in basal plates of PE placentas as compared to the second trimester, term and preterm labor samples.
The normalized log intensity values for the differentially expressed probe sets were centered to the median value of each probe set and colored on a range of −2.5 to +2.5. Red denotes up regulated and blue denotes down regulated expression levels as compared with the median value. Columns contain data from a single basal plate specimen, and rows correspond to a single probe set. Samples within each catergory are arranged from left to right, ordered by increasing gestational age. Rows are ranked by fold change. The complete heat map is shown in supplemental Fig. S1.

