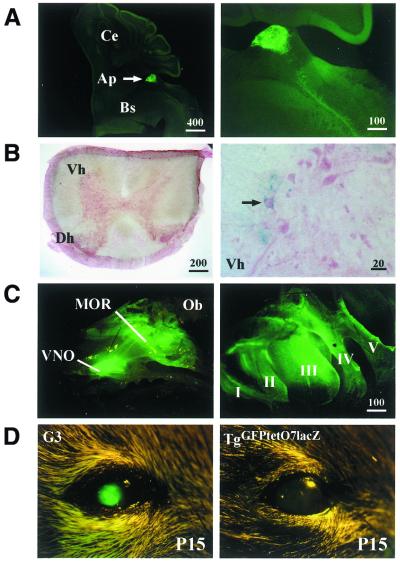
Figure 5.
α-CaMKII promoter controlled tTA activity at P15–22, visualized by GFP and β-galactosidase expression in offspring of reporter line G3 in (A) the area postrema (Ap) of the reticular formation visualized in sagittal sections of brainstem (Bs) and cerebellum (Ce); (B) ventral horn neurons in horizontal sections of the spinal cord (Vh, ventral horn; Dh, dorsal horn); and (C) primary olfactory neurons lining the main olfactory region (MOR), the vomeronasal organ of the septum (VNO; Ob indicates the position of the olfactory bulb) and the turbinates in the lateral side of the nasal cavity (roman numbers I–V) visualized after a sagittal cut through the skull. Scale bars are in µm. (D) shows fluorescent primary lens fibers detectable through the pupil of the mouse eye.

