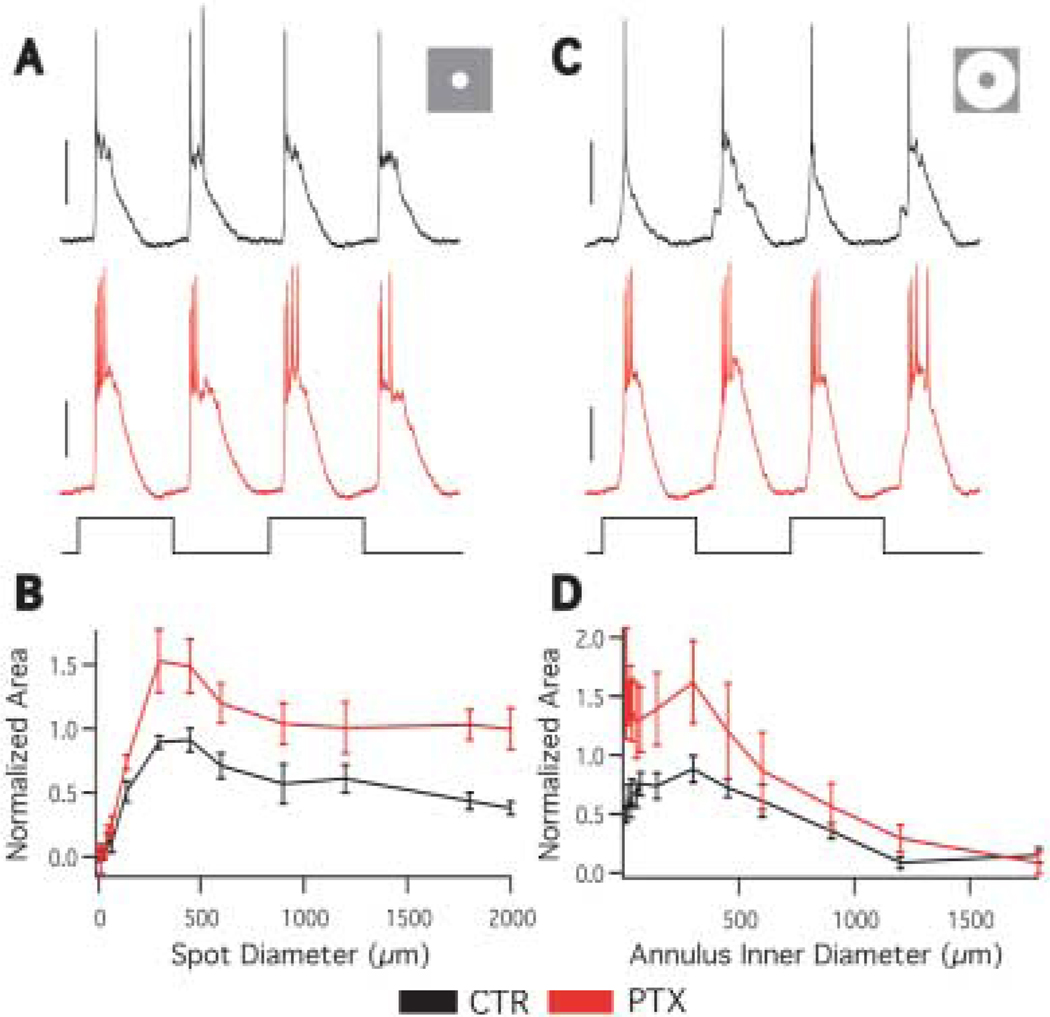
Fig. 4.
Effect of picrotoxin on A1 receptive field. A: Responses to a 450 µm spot in the absence (black) and presence (red) of 100-µM PTX (stimulus trace below). The picrotoxin response is larger than control. Scale bars = 10 mV. B: The averaged area response function in the absence (black) and presence (red) of PTX. PTX increases the response at all spot sizes, but surround antagonism is still present. n = 4. C: Responses to a 450 µm inner diameter annulus in the absence (black) and presence (red) of PTX (stimulus trace below). Scale bars = 20 mV. D: The averaged annulus response function in the absence (black) and presence (red) of PTX. PTX increases the response at all annulus sizes, though the increase is predominantly at small annulus inner diameters. n = 4.

