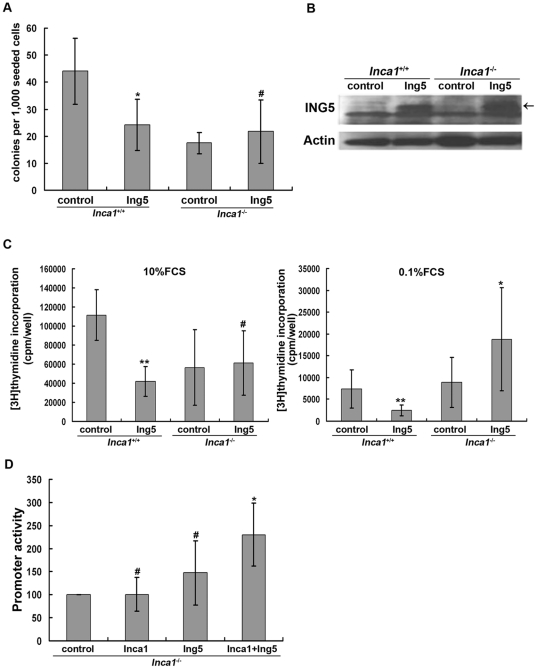
Figure 2. Inhibition of cell growth by ING5 depends on INCA1.
(A) Inca1 +/+ and Inca1 −/− bone marrow cells were retrovirally transduced with ING5 or empty vector, sorted by FACS, and then subjected to colony formation assays. Data are shown as mean plus standard error of three independent experiments (*P<0.05 compared to Inca1 +/+ control; #not significant). (B) Immortalized MEF cells from Inca1 +/+ and Inca1 −/− were retrovirally transduced with ING5 or empty vector. After being sorted by FACS, four stably transduced cell lines were established as bulk culture. ING5 overexpression was confirmed by Western blotting with anti-ING5 antibody. (C) Cell lines were cultured in medium containing 10% FCS or 0.1% FCS and analyzed for proliferation using [3H]thymidine incorporation. Data are shown as mean plus standard error of three independent experiments (**P<0.01 compared to Inca1 +/+ control; #not significant, *P<0.05 compared to Inca1 −/− control). (D) Inca1 −/− MEFs were transfected with ING5, INCA1 or both, and activation of a p53-responsive promoter was analyzed by luciferase assay. ING5 and INCA1 co-transfection led to activation of the promoter. Data are shown as mean plus standard error of three independent experiments (#not significant, *P<0.05 compared to control).

