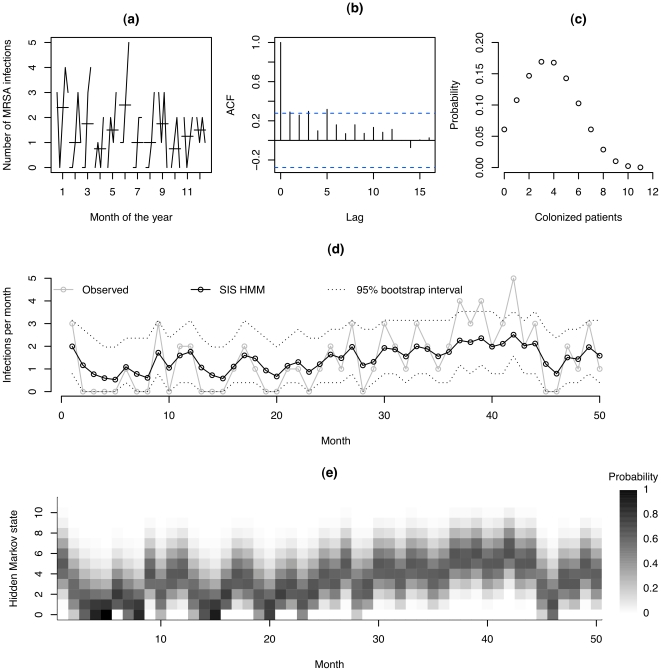
Figure 1. Preliminary analyses, and output from the structured hidden Markov model.
(a) seasonal subseries plot showing the number of infections for each month of the year (horizontal lines represent the mean number of infections for the given month); (b) autocorrelogram, showing the correlation between recorded monthly infections in data points separated by 0,1,2,3 months (lags); (c) Stationary distribution of number of colonized patients; (d) Observed number of new infections and the expected number of new infections in each month estimated through the structured hidden Markov model using the entire series of observations . Broken lines indicate central 95% bootstrap intervals obtained by conditioning on the hidden state, and sampling this hidden state from a multinomial distribution using probabilities estimated by fitting the model to data (see Figure 1 (e)) with 1000 bootstrap replicates; (e) Estimated conditional probabilities of different hidden states over time,
  .
.

