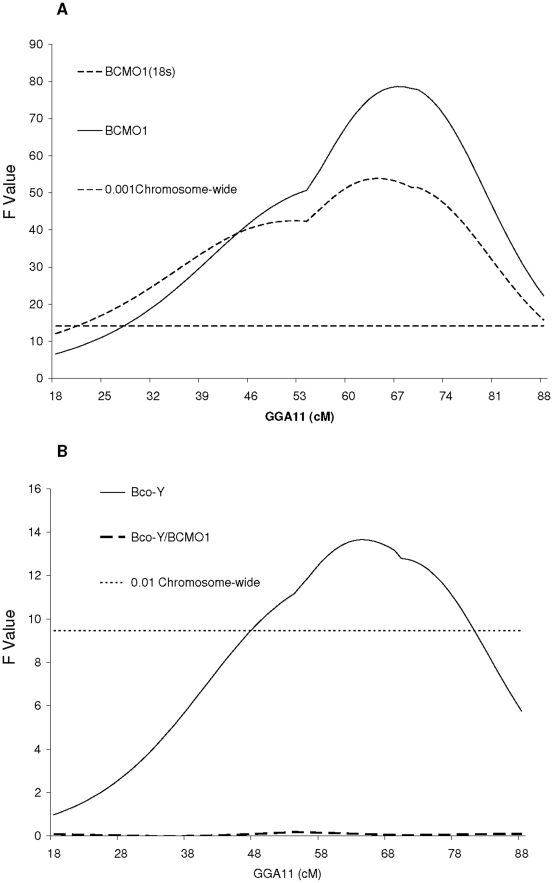
Figure 3. Identification of an eQTL controlling BCMO1 mRNA levels.
(a) A strong cis eQTL for absolute (dCT BCMO1, solid line) or relative (dCT BCMO1-dCT 18S, dashed line) BCMO1 mRNA levels is detected on GGA11 (b). The QTL for BCo-Y (solid line) completely disappeared (dashed line) when BCMO1 mRNA level (dCT BCMO1) was considered as covariate in the model.

