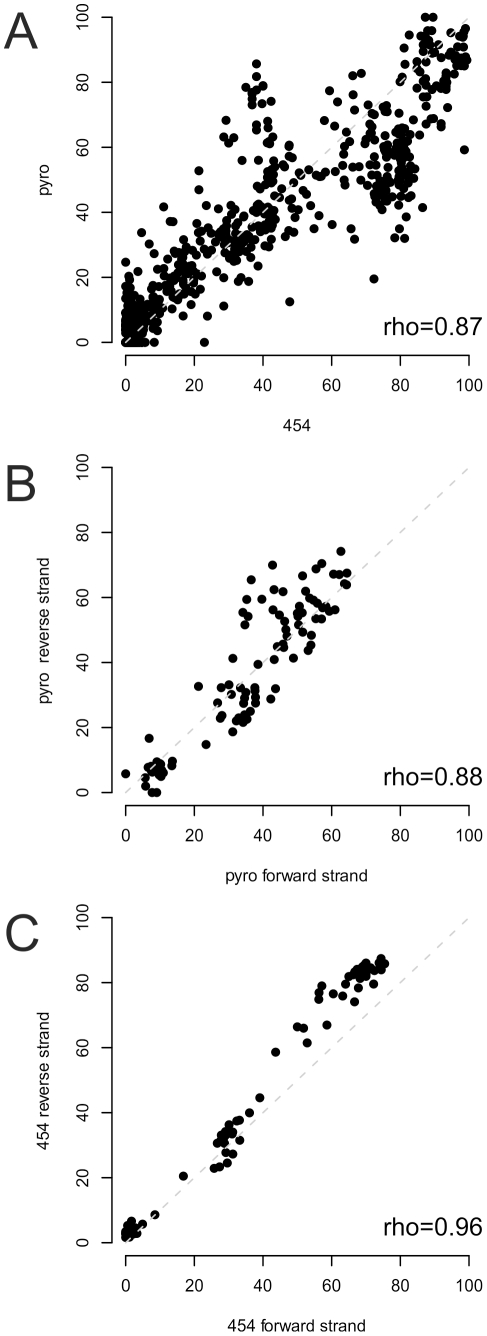
Figure 4. Panel A depicts the correlation of the degree of methylation as measured by pyrosequencing (y-axis, denoted “pyro”) and by sequencing of the droplet-PCR products (x-axis, denoted “454”) for all 248 CpG loci studied with both methods in the panel for all four samples.
The Spearman rank correlation coefficient is denoted in the Figure as “rho”. Panels B and C provide a pairwise correlation plot and analysis of the degree of methylation for the forward and reverse strand for 25 CpG sites in the IGF2 gene.

