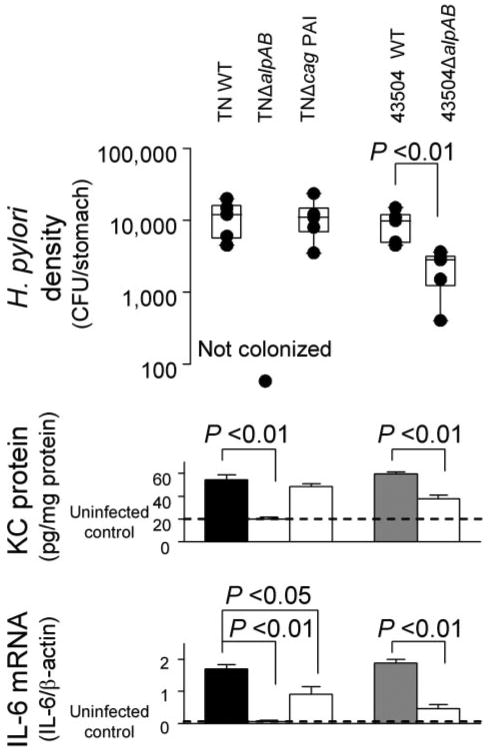
FIGURE 10. H. pylori density and mucosal KC and IL-6 levels in mice 8 weeks after inoculation.

The end of the bars indicates the 25th and 75th percentiles in H. pylori density (top). The median is indicated with a solid line in the box, and the 10th and 90th percentiles are indicated with error bars. Middle, KC protein levels in the gastric mucosa of the mice; bottom, IL-6 mRNA levels in the gastric mucosa of the mice. IL-6 mRNA levels are presented as ratio of 10× IL-6 mRNA to β-actin mRNA. CFU, colony-forming units.
