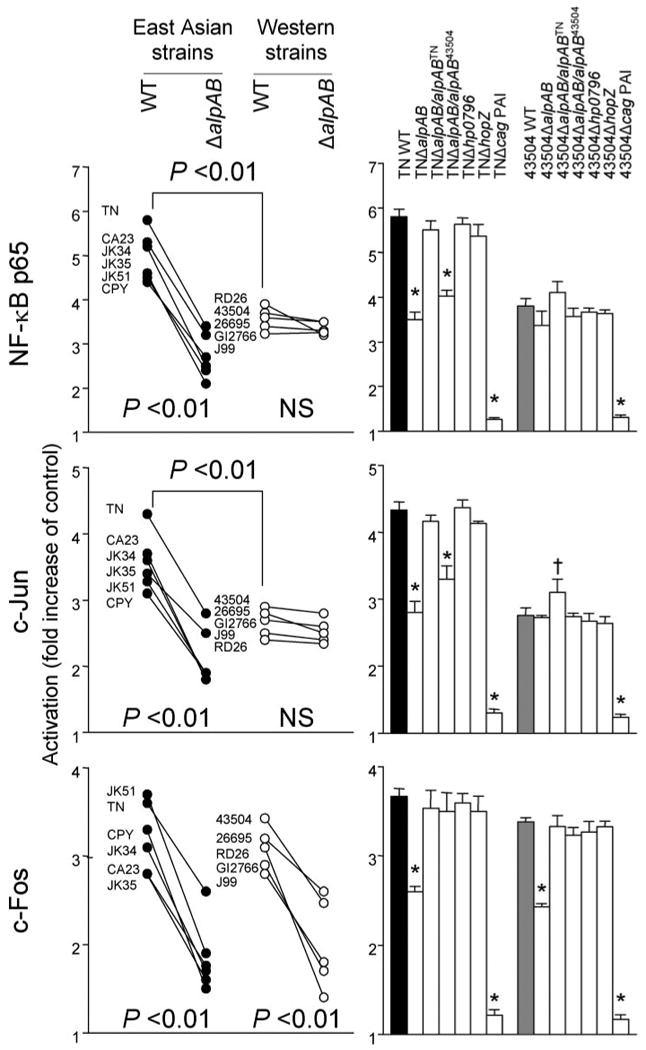
FIGURE 7. Activation of NF-κB p65, c-Jun, and c-Fos following H. pylori infection.

Three independent co-cultures were performed. Nuclear extracts prepared from MKN28 cells (uninfected control or infected with H. pylori for 90 min) were analyzed by ELISA. Data are expressed as mean (left panel) and mean ± S.E. (right panel). *, p < 0.01 decreased compared with WT strains; †, p < 0.01 increased compared with WT strains. NS, not significant.
