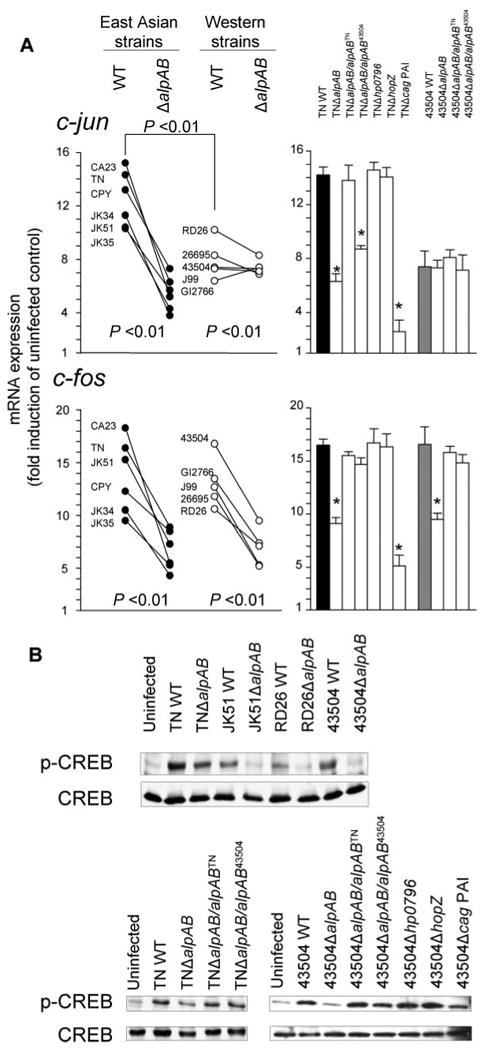
FIGURE 8. The expression of c-fos and c-jun mRNAs (A) and CREB phosphorylation (B) in MKN28 cells following H. pylori infection.

Data at 1 h were presented. A, three independent co-cultures were performed, and each was measured by real time RT-PCR in duplicate. Expression levels were normalized to glyceraldehyde-3-phosphate dehydrogenase mRNA levels and expressed as -fold induction relative to uninfected controls. Data are expressed as mean (left) and mean ± S.E. (right). *, p < 0.01 compared with the WT strain. B, three independent co-cultures were performed, and typical immunoblot results are presented. Typical blots for four parental strains and their ΔalpAB mutants (top) and strains TN and 43504 and their various mutants (bottom) are presented.
