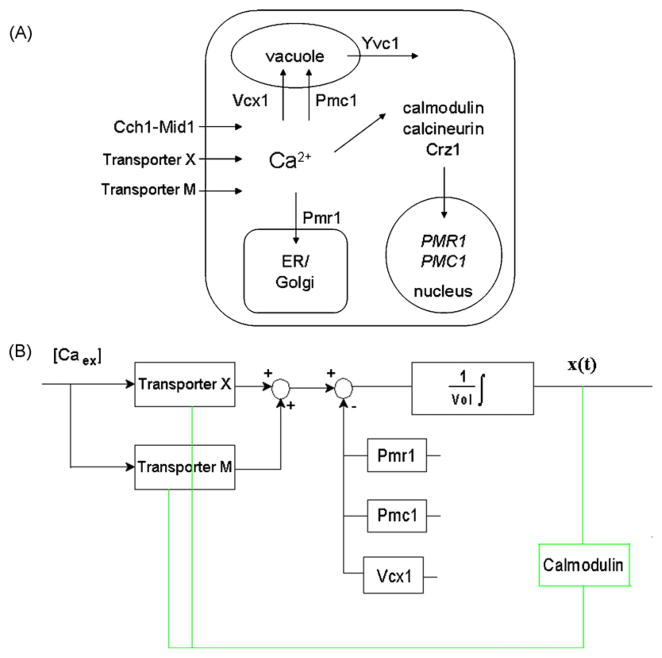
Fig. 1.
Schematic graph of the system and control block diagram. Panel A, A schematic graph of Ca2+ homeostasis/signaling system in yeast cells (for details, please see the text in Section 1). Transporter M is newly detected in this work and is assumed to open under extremely high extracellular Ca2+ concentration. Panel B, Control block diagram of our model. In yvc1 cch1 yeast cells, the cytosolic Ca2+ influx is through Transporter X and an assumed Transporter M, the cytosolic Ca2+ efflux is through Pmc1, Pmr1 and Vcx1. For yeast cells with fixed volume, the cytosolic Ca2+ concentration (i.e., x(t)) is the integral of the flux rate difference (i.e., influx rate subtracting efflux rate) divided by the cytosolic volume. The green lines describe the feedback loop: cytosolic Ca2+ concentration is sensed by the calmodulin and Ca2+-bound calmodulin is assumed to inhibit the activity of both transporters M and X. (For interpretation of the references to color in this figure legend, the reader is referred to the web version of the article.)

