
Fig. 8.
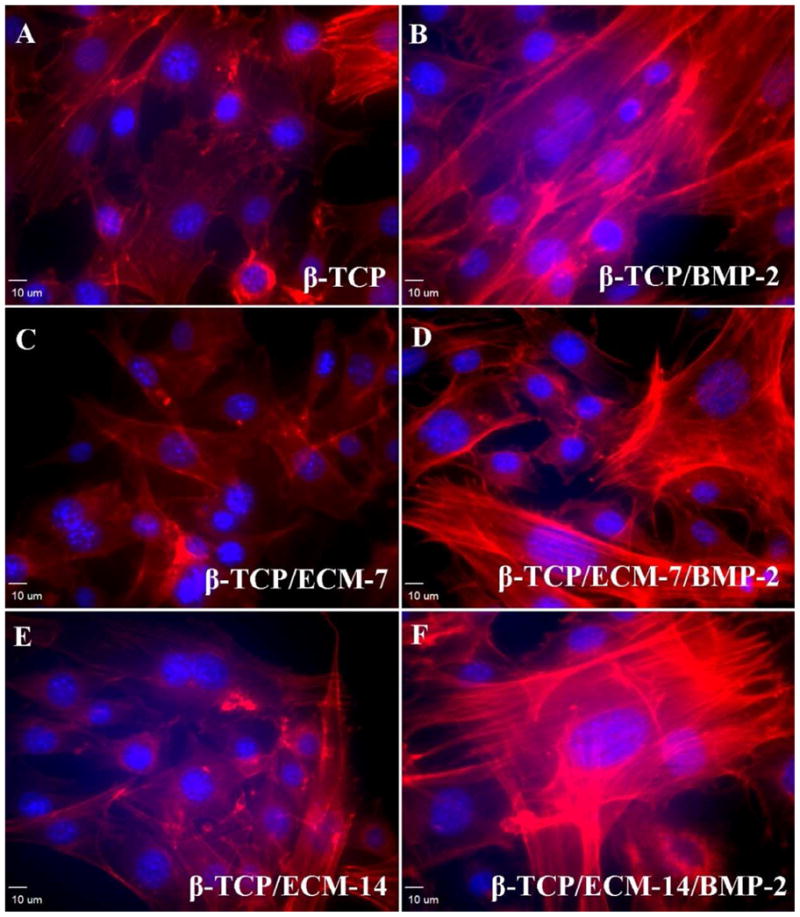
Representative immunofluorescent images for F-actin distribution in hBMSCs taken by a confocal laser scanning microscope after 3 days incubation. (A) Cells in the β-TCP scaffolds group; (B) Cells in the BMP-2-loaded β-TCP scaffolds; (C) Cells in the β-TCP/ECM-7 scaffolds; (D) Cells in the BMP-2-loaded β-TCP/ECM-7 scaffolds; (E) Cells in the β-TCP/ECM-14 scaffolds; and (F) Cells in the BMP-2-loaded β-TCP/ECM-7 scaffolds. Magnification: 20×; scale bar: 10 μm.