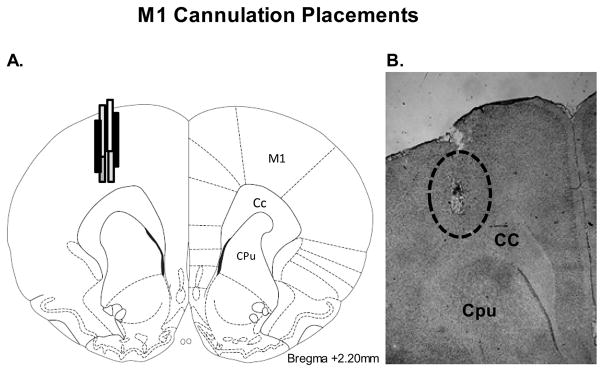
Figure 2. Cortical cannulation placements.
Schematic representation (A) and representative cresyl violet-stained section (B) of M1 sections portraying typical injector placement. Schematic representation of coronal rat brain section taken from Paxinos and Watson (1998). The dashed circle depict the distribution of M1 microinfusion sites in rats used in Experiments 2 and 3. (Relevant anatomical structures: Cc, corpus callosum; Cpu, caudate putamen; M1, primary motor cortex).

