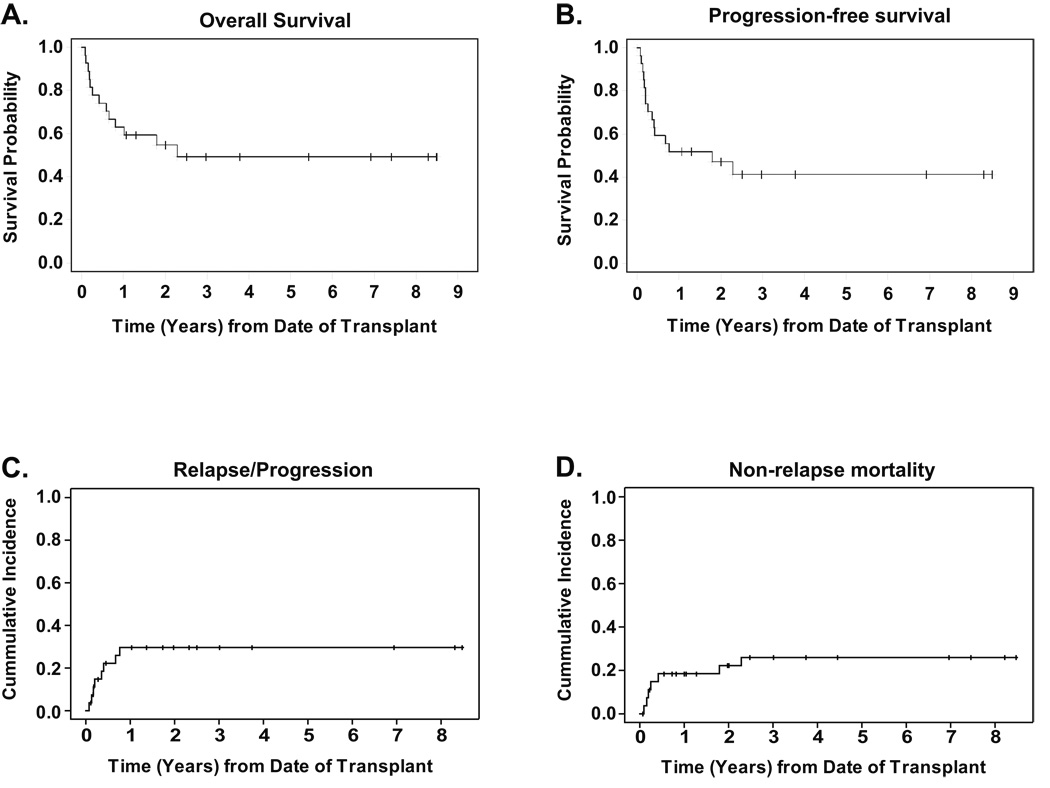
Figure 1. Outcomes.
All curves are for the 27-patient population with a median follow-up of 35.7 months for survivors. Panel A shows the Kaplan-Meier estimate of survival probability. Panel B shows progression-free survival, defined as time from stem cell infusion to recurrence, progression, or death from any cause, whichever occurred first. Panel C shows cummulative incidence of relapse/progression, defined as time from stem cell infusion to recurrence or progression. Panel D shows non-relapse mortality, measured as time from stem cell infusion to death from any cause other than disease relapse or disease progression. In panels C and D, relapse/progression and non-relapse mortality were treated as competing risks.

