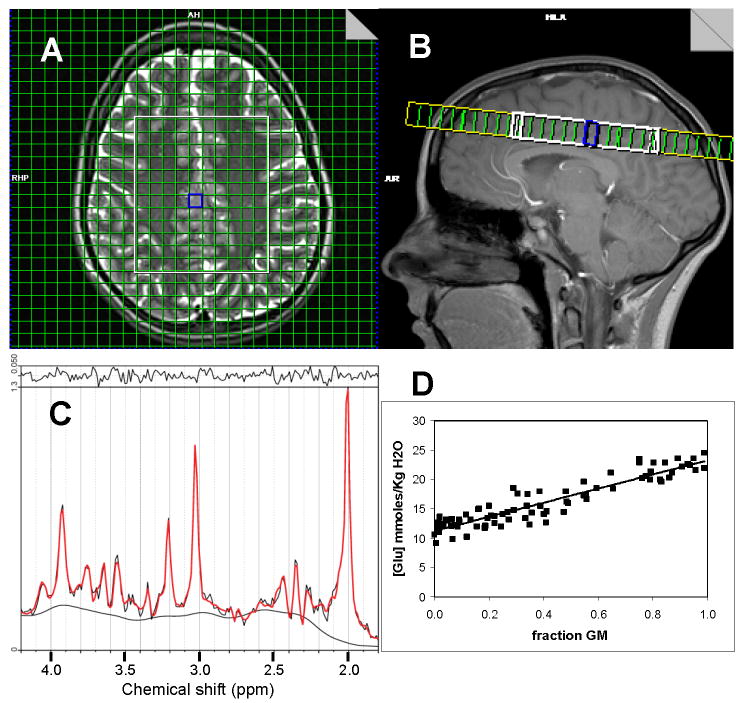
Figure 1.
A) Location of 1H-MRSI excitation volume (white rectangle) and measured voxels (green grid within white rectangle) overlaid on T2-weighted image. B) Sagittal view of 1H-MRSI excitation volume. C) LCModel fit of representative spectrum from gray matter voxel outlined in blue in images of A and B. D) Regression analysis of Glu data from all analyzed voxels. The horizontal axis is the GM fraction of the total tissue (GM + WM) fraction.

