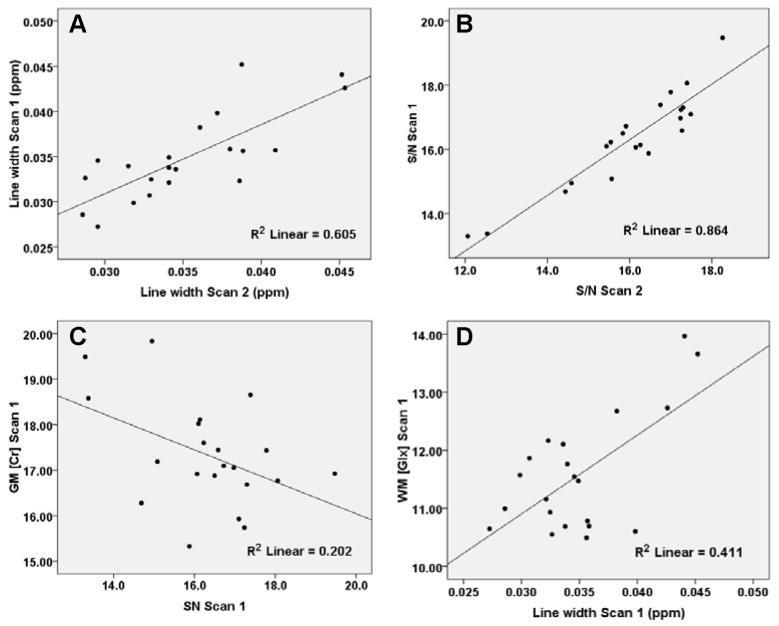
Figure 3.
A) Plot of mean 1H-MRSI data set line width for first scan versus second scan. B) Plot of mean 1H-MRSI data S/N for first scan versus second scan. C) Plot of estimate of GM Cr concentration versus mean S/N across subjects. D) Plot of estimate of WM Glu concentration versus mean S/N across subjects. The correlations were significant for data sets before removal of outliers (see Table II).

