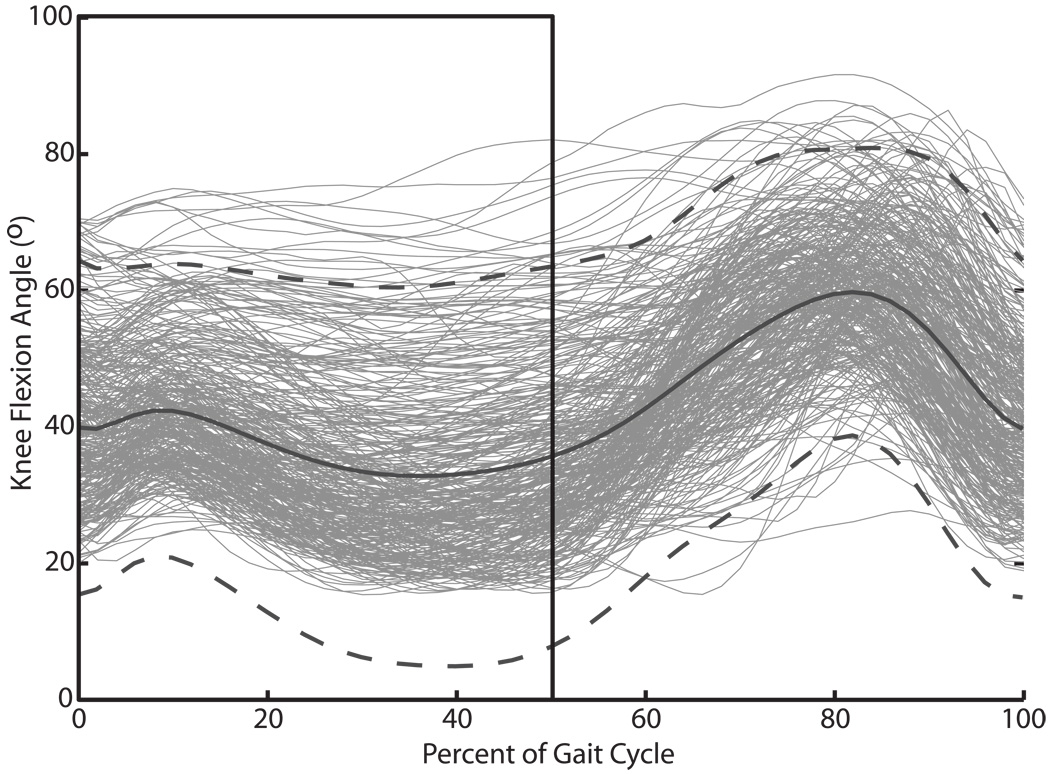
Figure 1.
Knee flexion kinematics at the initial gait analysis. The black solid curve and dashed curves show the mean knee flexion angle over the gait cycle +/− 2 SD for the entire group of limbs. The black box highlights the portion of the knee flexion curve used to derive the mean stance knee flexion measure, our metric to assess improvement in crouch gait.

