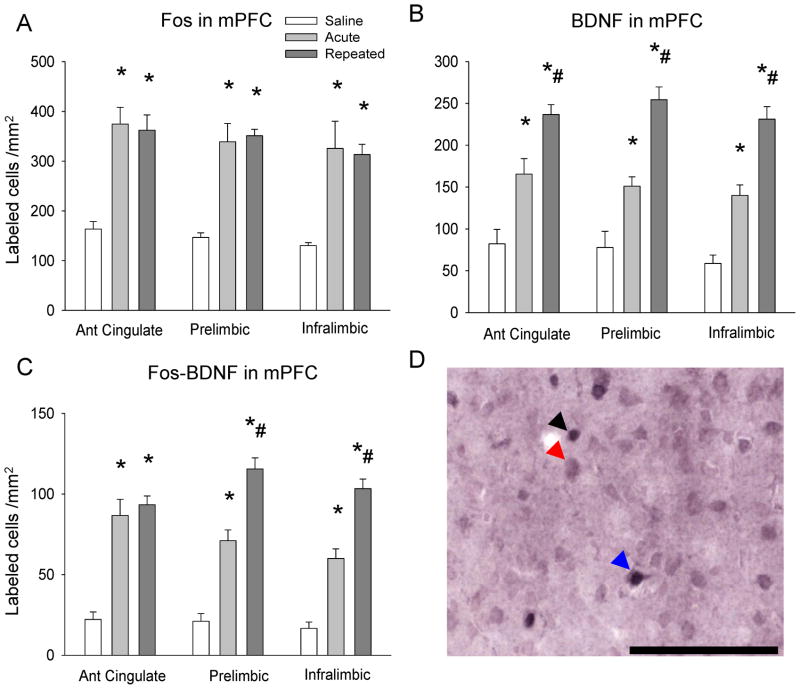
Figure 2. Fos and Fos-BDNF immunolabeling in mPFC subregions after drug challenge.
A – Fos immunolabeling in mPFC after drug challenge; B – BDNF immunolabeling in mPFC after drug challenge; C – Fos-BDNF double-immunolabeling in mPFC after drug challenge; *p ≤ 0.05 vs. saline group; #p ≤ 0.05 vs. acute group; D – Representative photomicrograph of Fos and BDNF single and double-immunolabeling in mPFC. Black arrow indicates Fos immunolabeled cell; red arrow indicates BDNF immunolabeled cell; blue arrow indicates Fos-BDNF double-immunolabeled cell. Scale bar 100 μm.

